The Wednesday Roundup: May 8, 2024
As we navigate the opening months of 2023, the financial markets continue to grapple with several dynamic forces shaping the landscape.

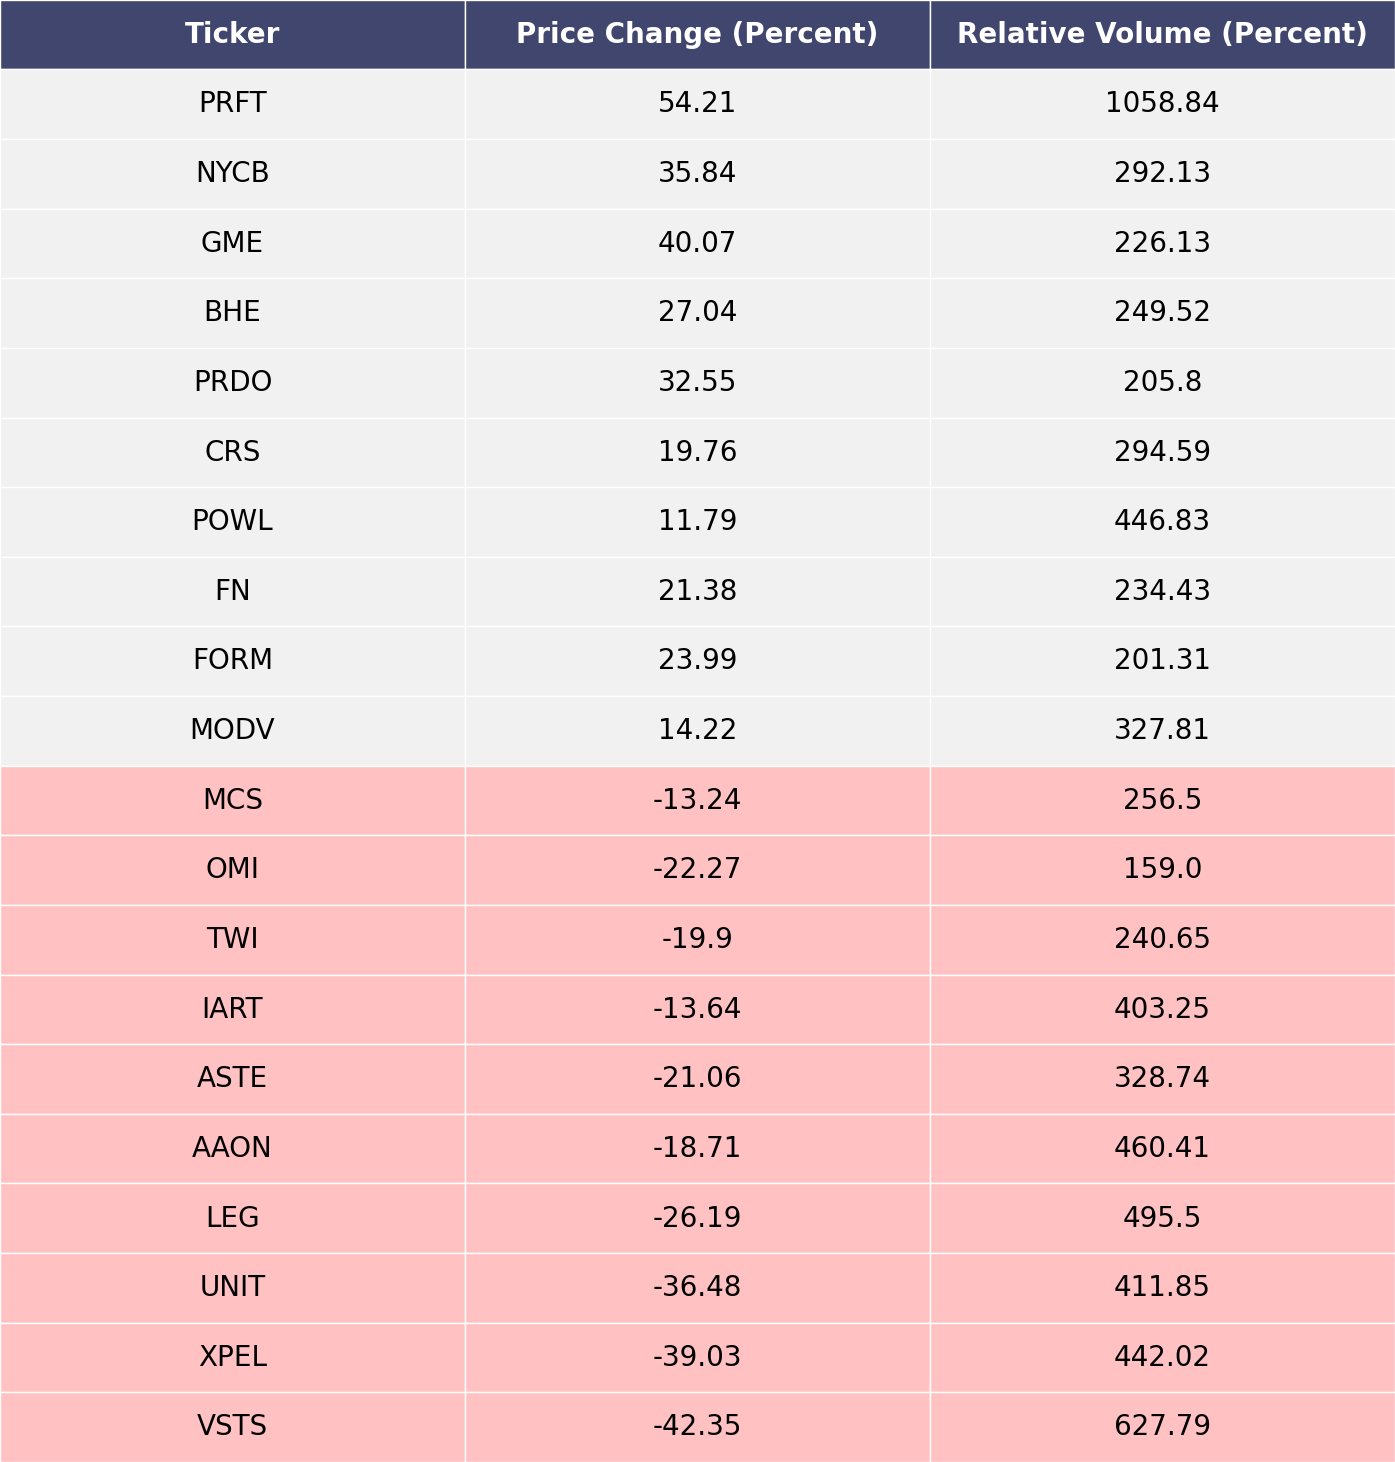
The biggest movers over the last week on price and volume (Mid Cap S&P 400 and Small Cap S&P 600)
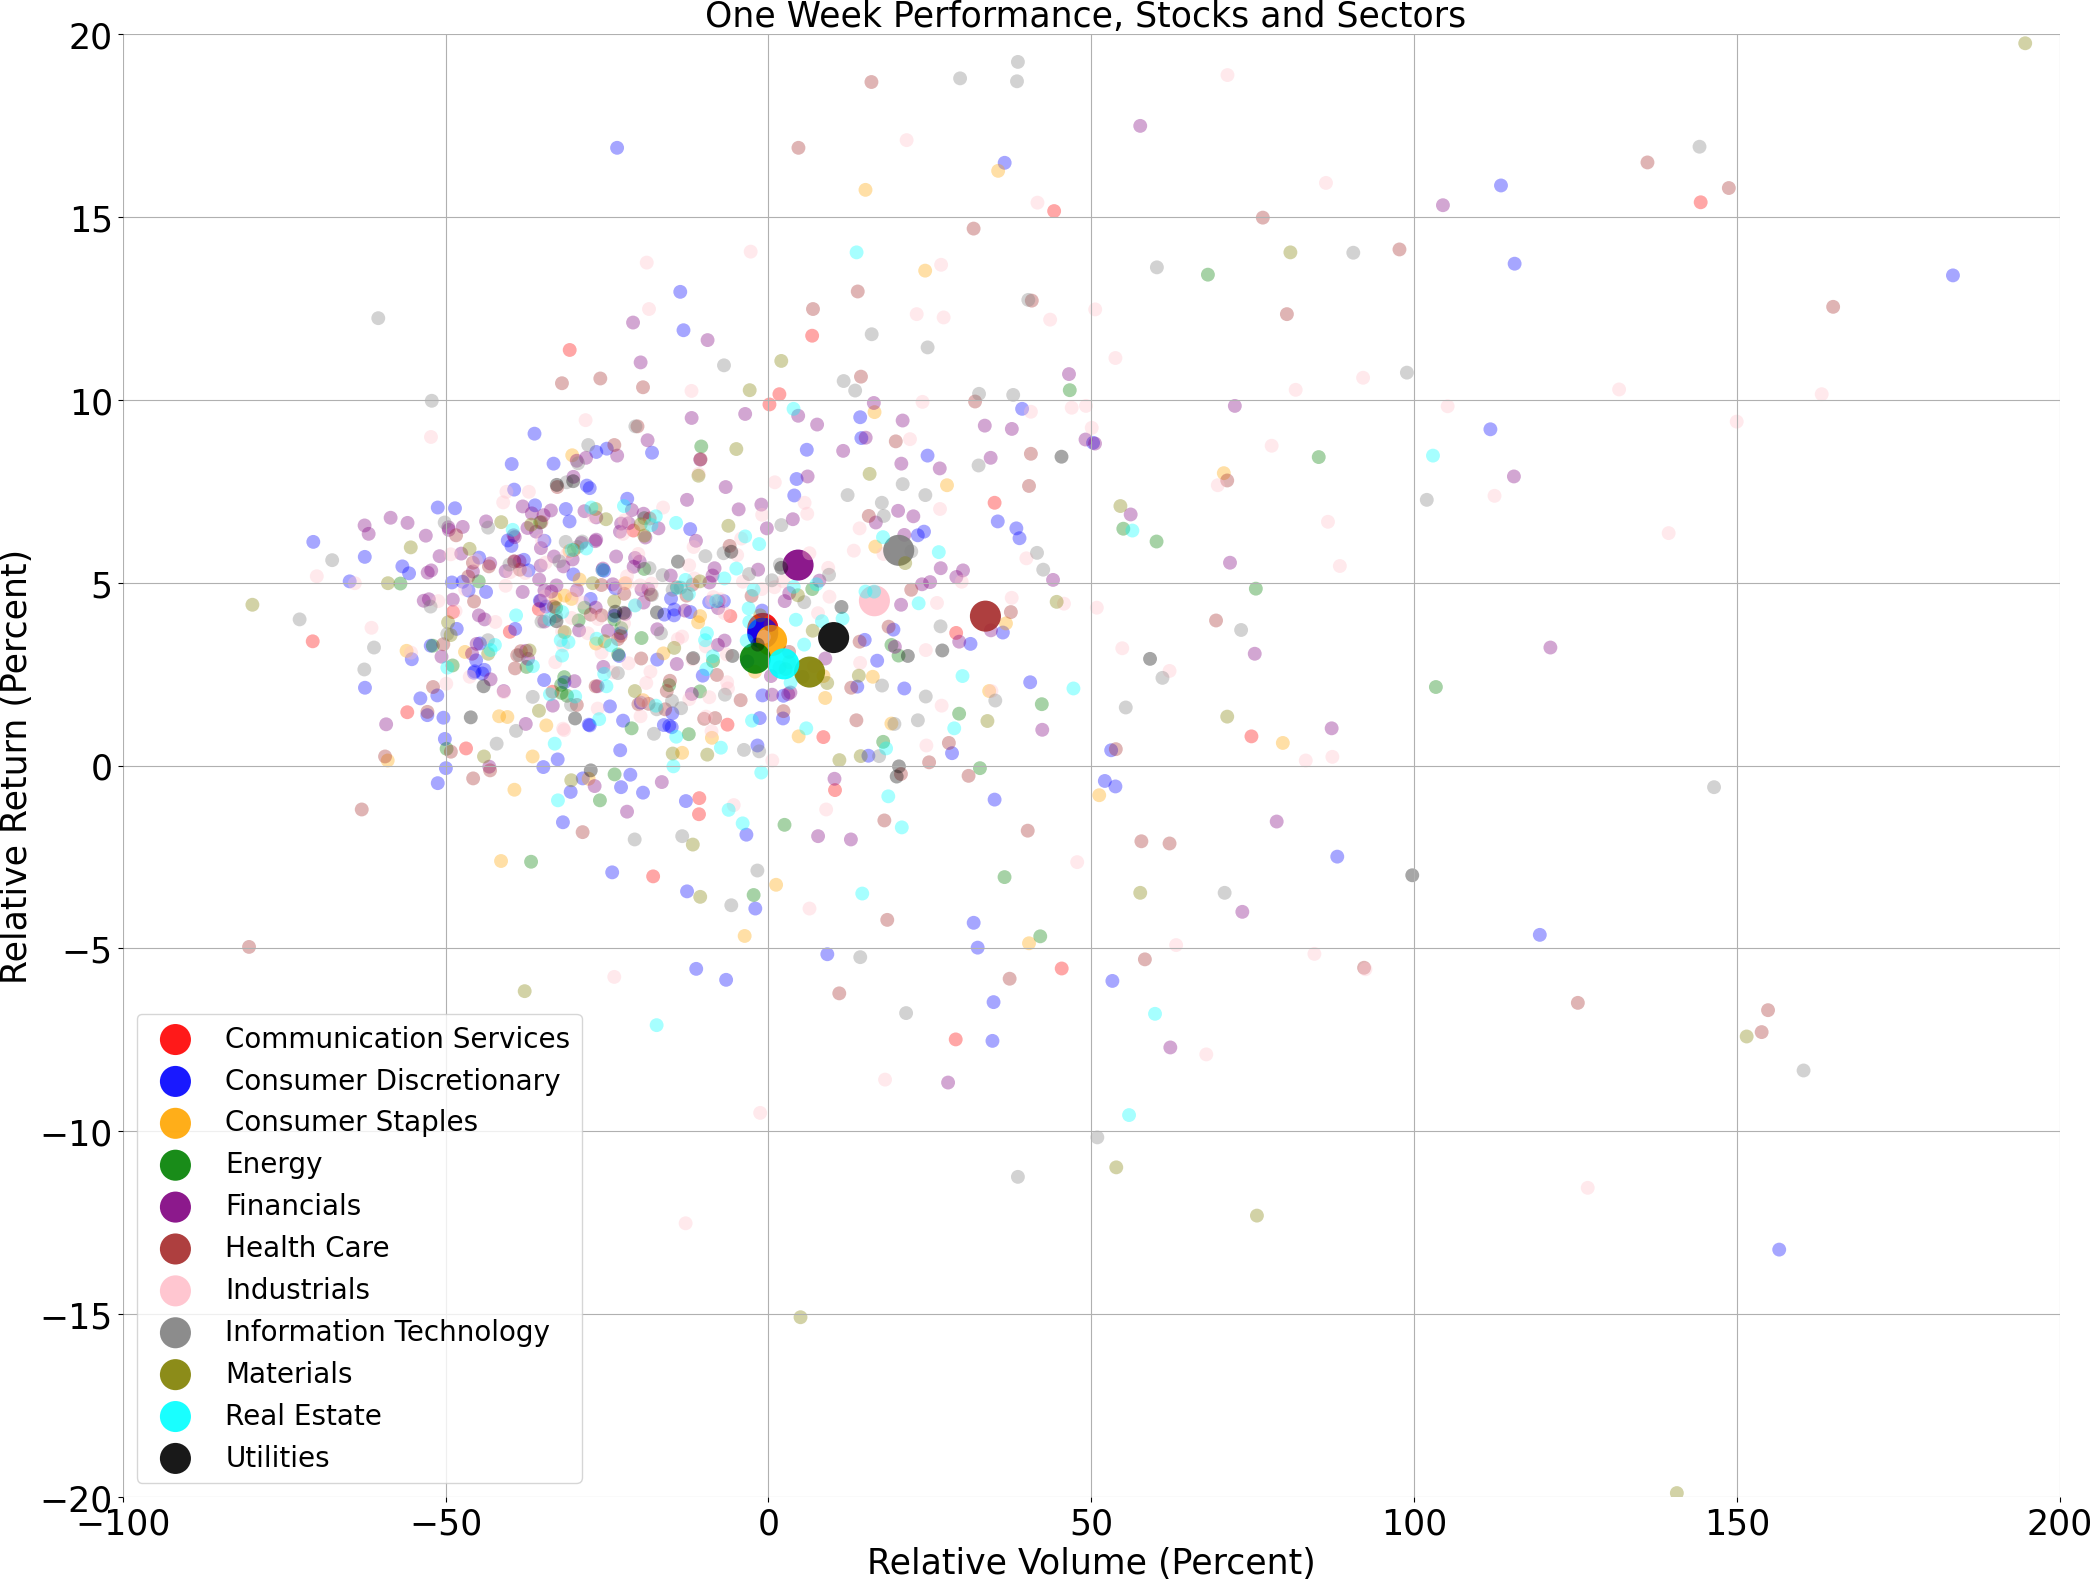
Price and volume moves last week for every stock and sector (Mid Cap S&P 400 and Small Cap S&P 600)
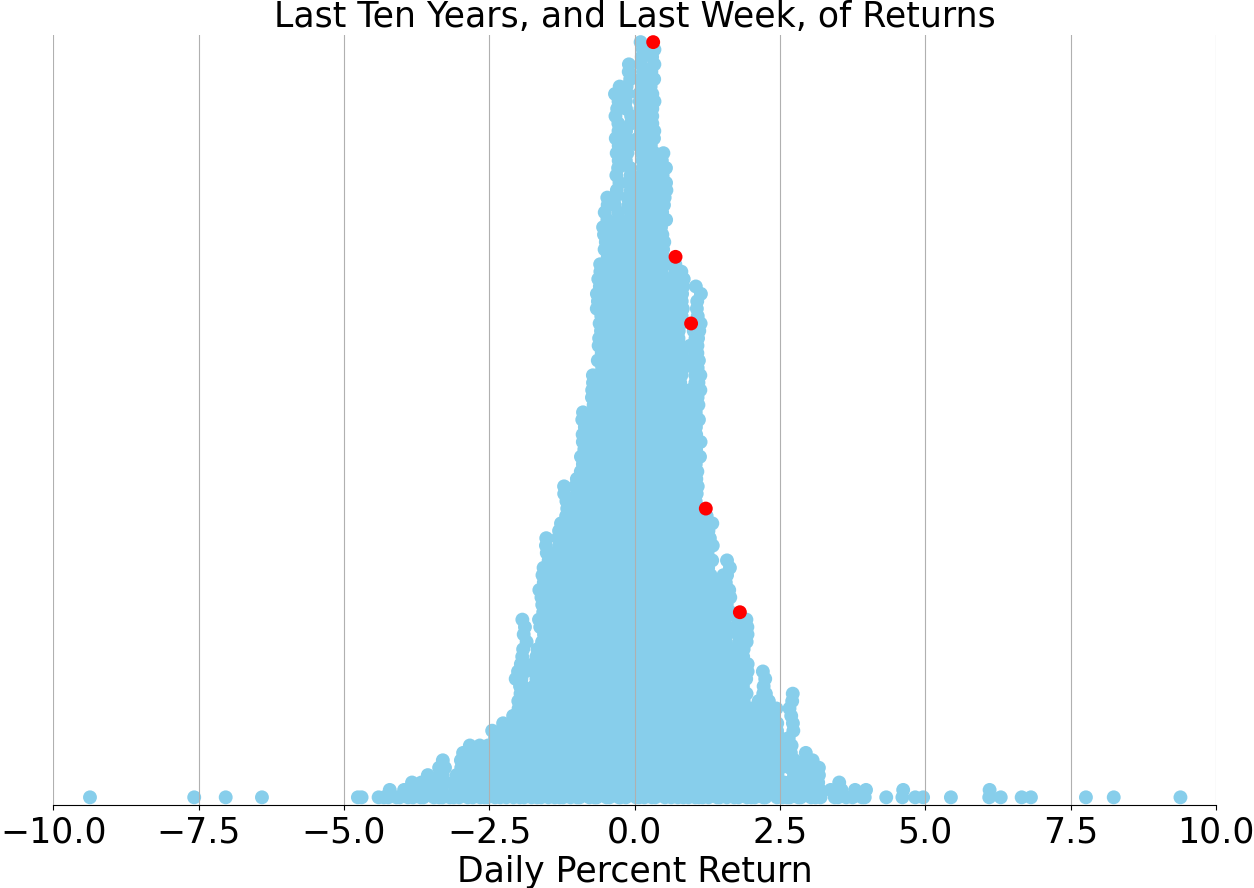
Last week vs. history (Mid Cap S&P 400 and Small Cap S&P 600)
AI Oracle Commentary (Alpha testing)
As we navigate the opening months of 2023, the financial markets continue to grapple with several dynamic forces shaping the landscape. Volatility remains a steadfast companion, primarily driven by concerns over inflationary pressures, tightening monetary policies by central banks, and geopolitical tensions that add layers of unpredictability. Corporate earnings, while robust in some sectors, suggest a divergence in performance, with technology and consumer discretionary stocks feeling the brunt of a potential demand slowdown. Commodity-driven sectors, on the other hand, bolstered by persistent supply chain issues and the ongoing war in Ukraine, appear more resilient. Moreover, whispers of stagflation—characterized by slowing growth and persistent inflation—keep investors on edge, fostering an atmosphere of caution and selectivity in stock picking.
Drawing Parallels: Stock Market Analogues of the Past 50 Years
History may not repeat itself, but it often rhymes. As investors cast a wary eye on the current market, echoes from the past offer valuable lessons. The oil crisis of the 1970s, the dot-com bubble of the late 1990s, and the financial crisis of 2008 all serve as stark reminders of how external shocks, speculative excesses, and systemic weaknesses can conspire to disrupt markets. Similar to today's inflation woes, the 1970s saw spiraling costs of goods, albeit compounding with energy supply shortages that kneecapped the then global economy—resulting in a protracted period of poor stock market performance and economic malaise. On the flipside, the irrational exuberance of the late '90s tech rally mirrors some of today's market sentiment before the eventual correction—where valuations divorced from fundamentals, priming for a reversion. Like the historical tapestry these eras have woven, today's market conditions suggest that valuation, economic cycles, and liquidity are evergreen indicators of market health and trajectory.
Historical Performance as a Beacon: Quantitative Reflections and Predictions
Reviewing market performance over the last half-century, the compounded annual growth rate (CAGR) of the S&P 500 sits around 7-10% when adjusted for inflation. This enduring rise is punctuated by pullbacks and bear markets where losses ranged from 20% to over 50%, as seen during the Great Recession. Despite this, the market's tendency to climb over the long haul remains undeterred. Drawing on the quantitative patterns of yore, we might speculate that while the immediate future could be choppy owing to rate hikes and fiscal tightening, the long-term prospects still favor a positive uptrend. If we apply historical growth rates and consider a potential cooling-off in inflation and resolution of geopolitical tensions, the market could witness a modest recovery, averaging a 5-8% gain for the upcoming 12 months. This projection is contingent upon a gradual stabilization of macroeconomic factors and a softening of the interest rate hike cycle. Should these conditions materialize, the market's historical resilience hints at a slow yet inexorable march upward, shaped by the indomitable spirit that has characterized its past.
AI stock picks for the week (Mid Cap S&P 400 and Small Cap S&P 600)
Subscribe for AI stock picks (it's free!)