
The Monday Charge: September 9, 2024
In a week marked by a palpable shift in sentiment, the latest U.S. labor market data has painted a picture of a cooling economy. Job openings have dwindled to around 7.7 million, the lowest level this year, signaling a softening demand for labor...

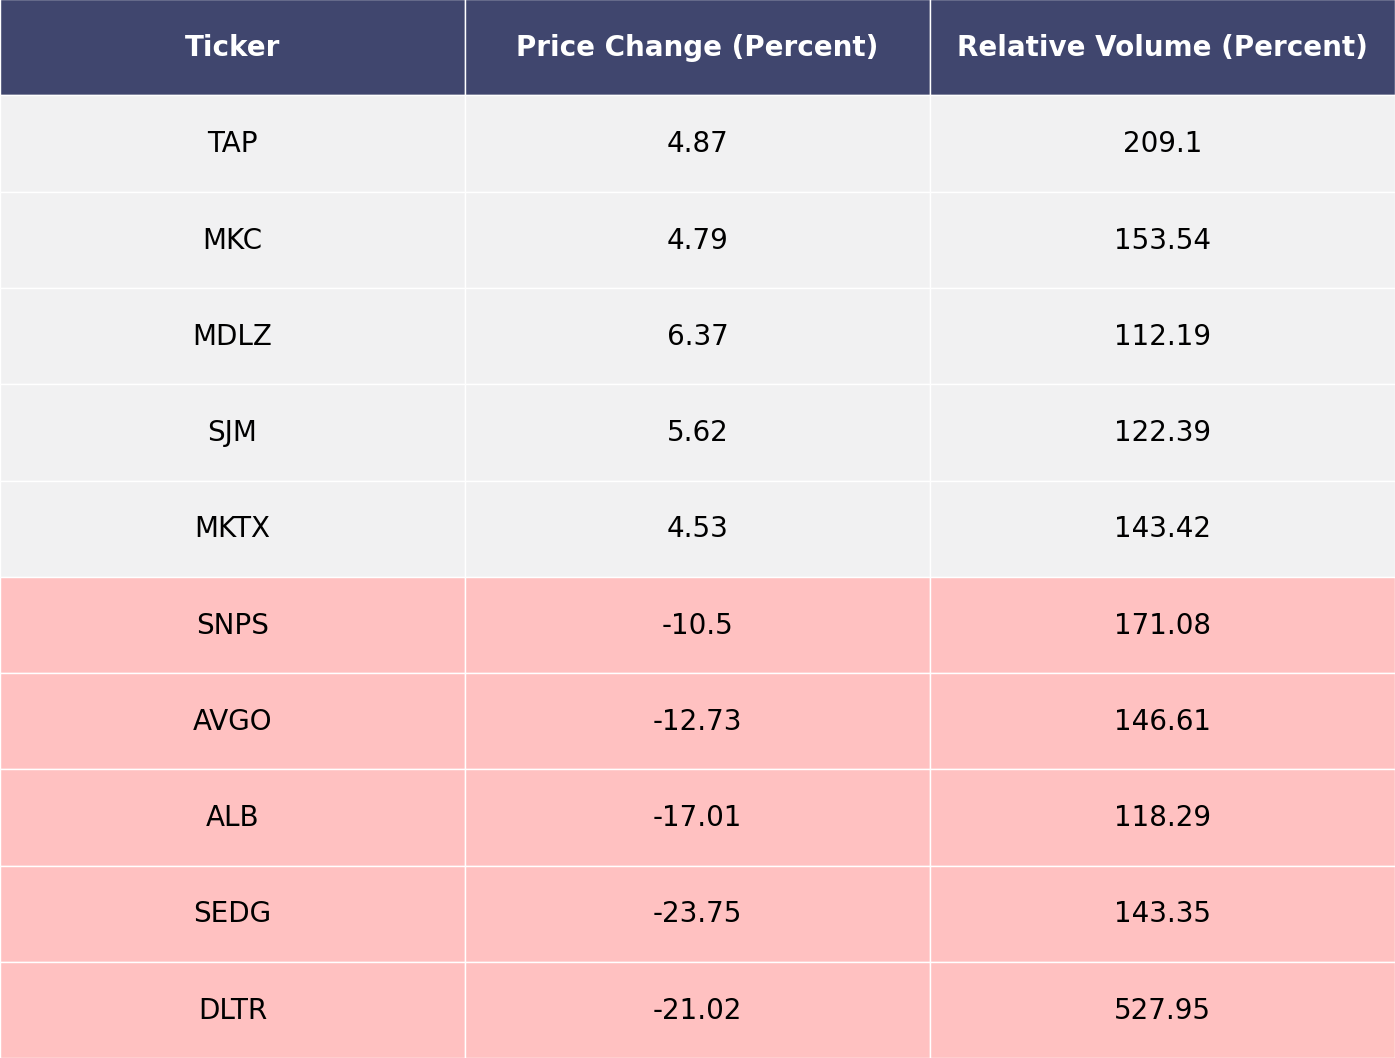
The biggest movers last week on price and volume (Large Cap S&P 500)
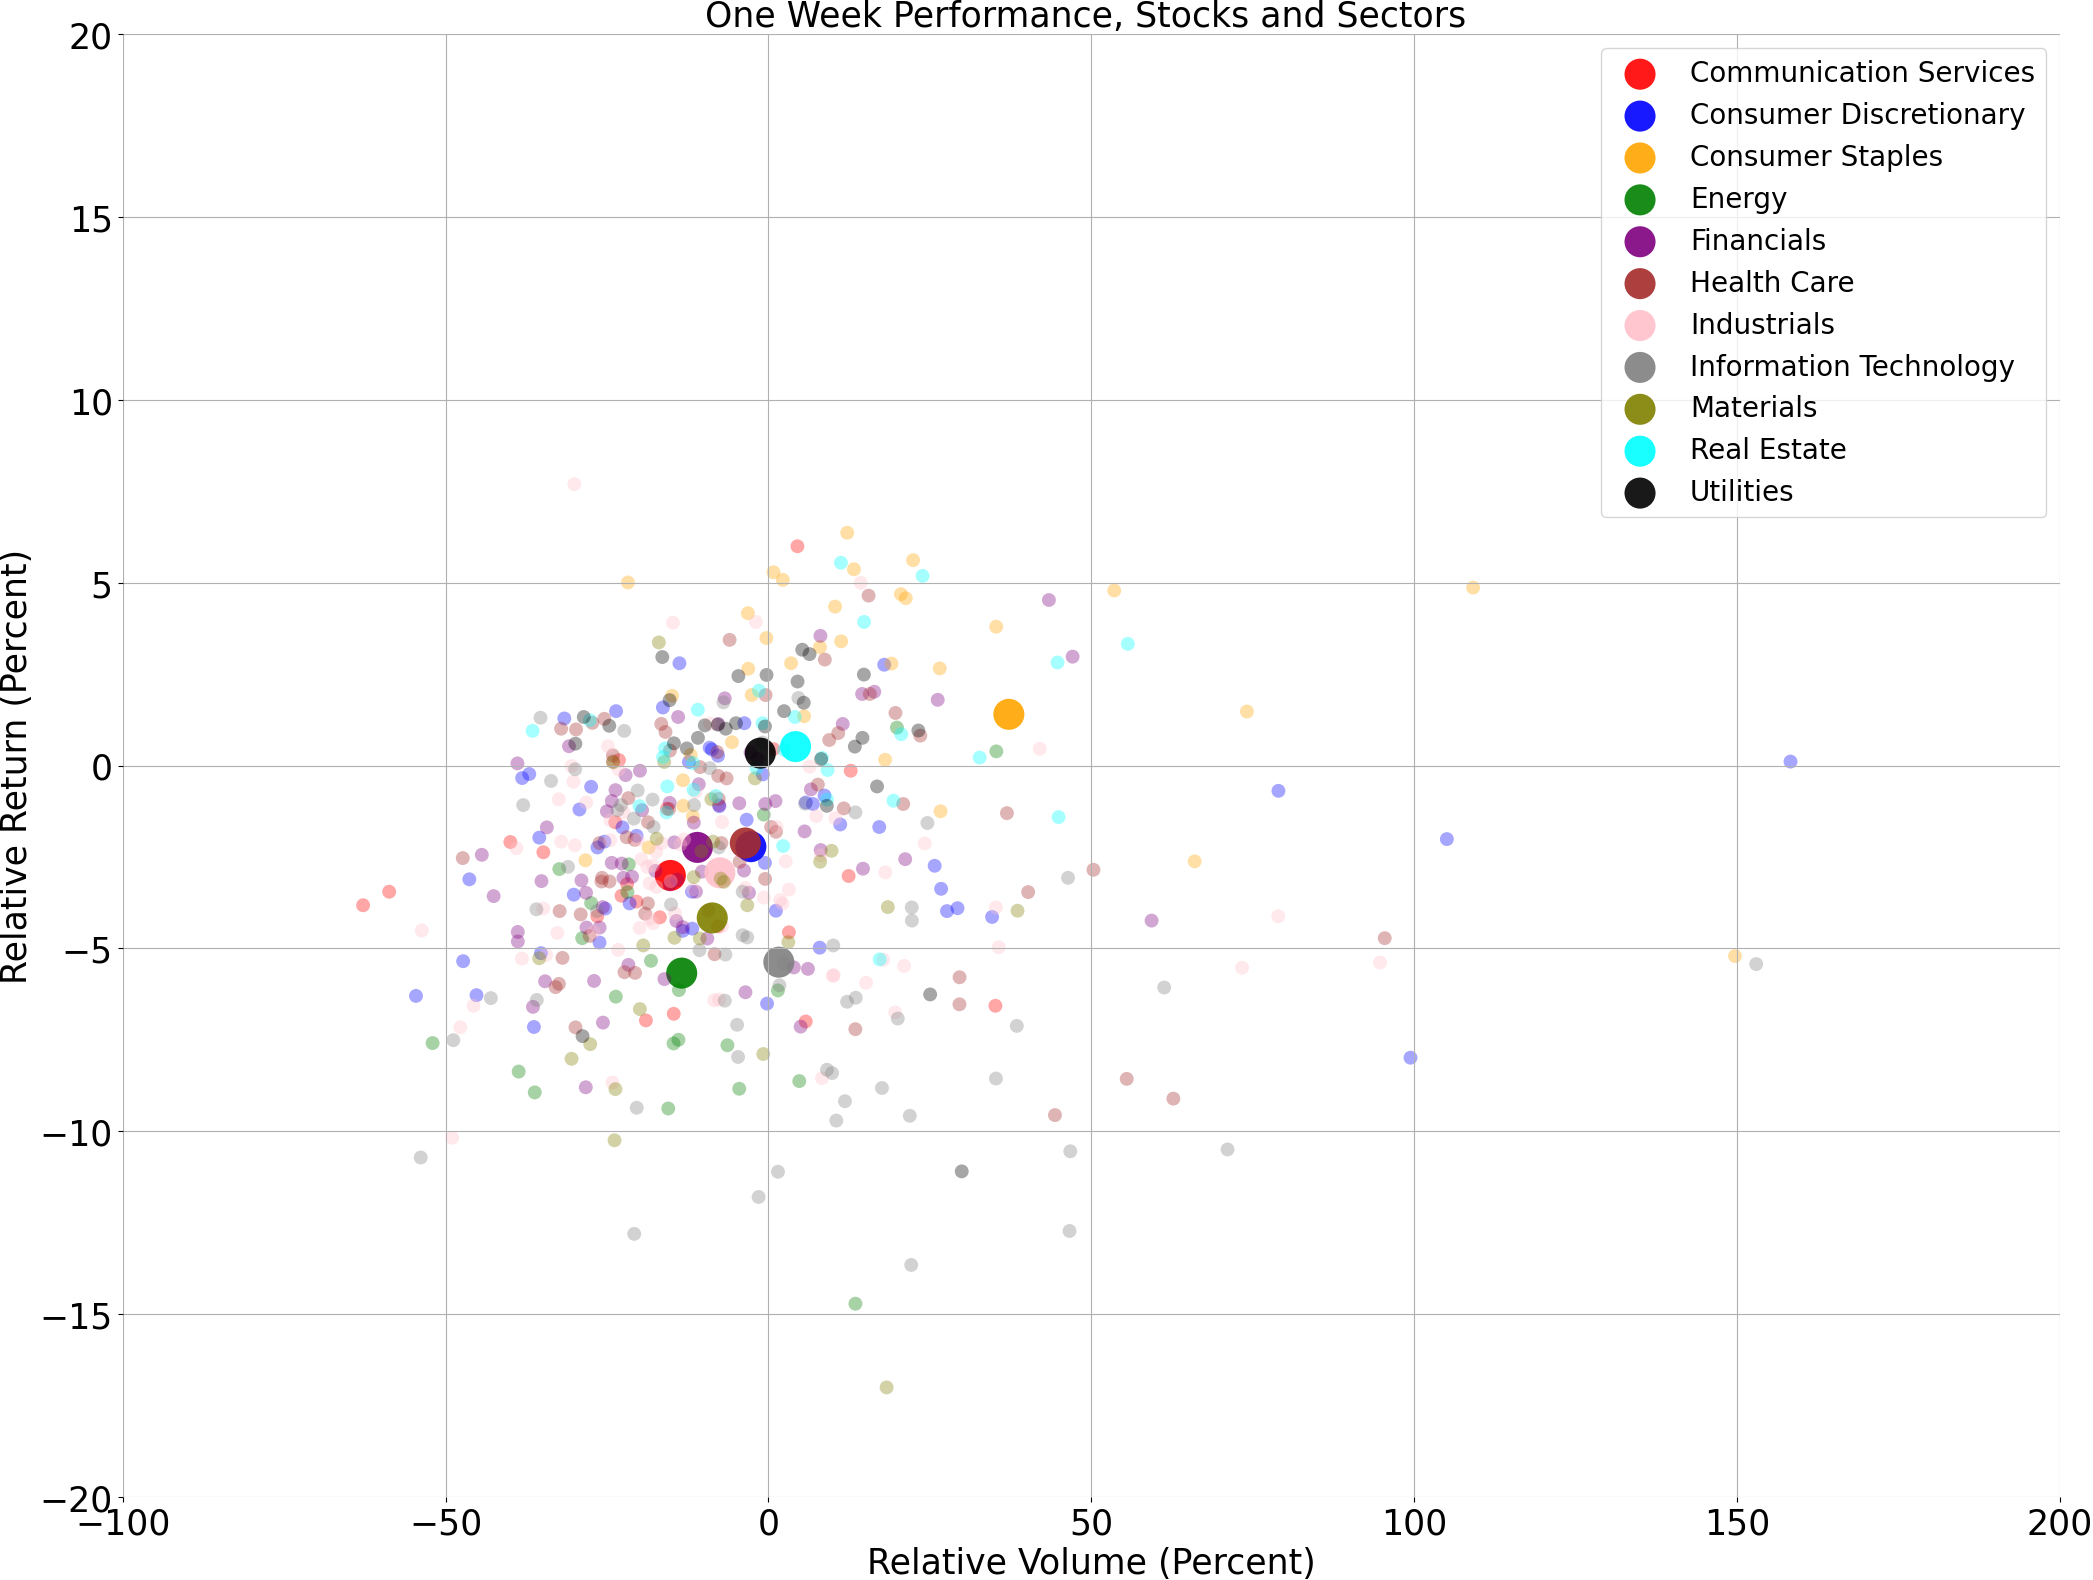
Price and volume moves last week for every stock and sector (Large Cap S&P 500)
A technical analysis across indices
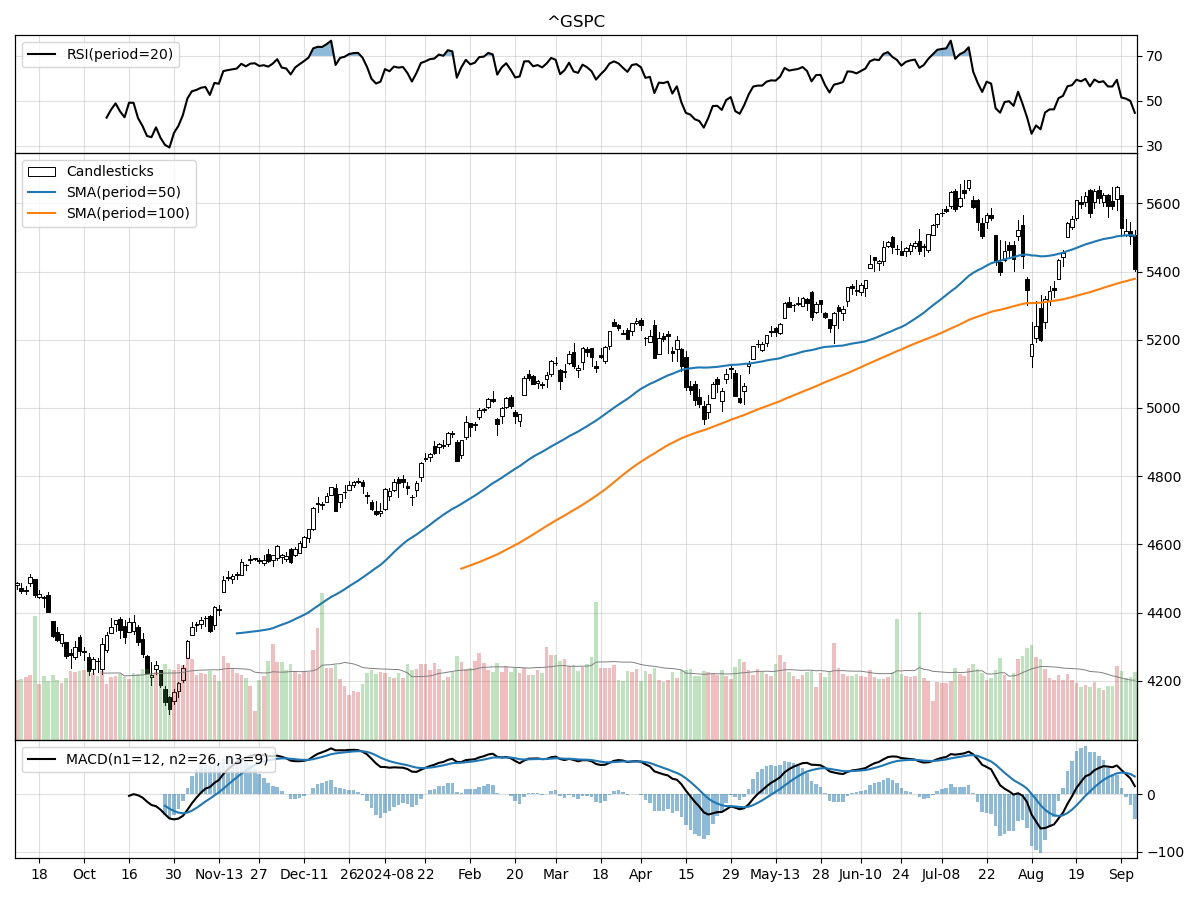
S&P500
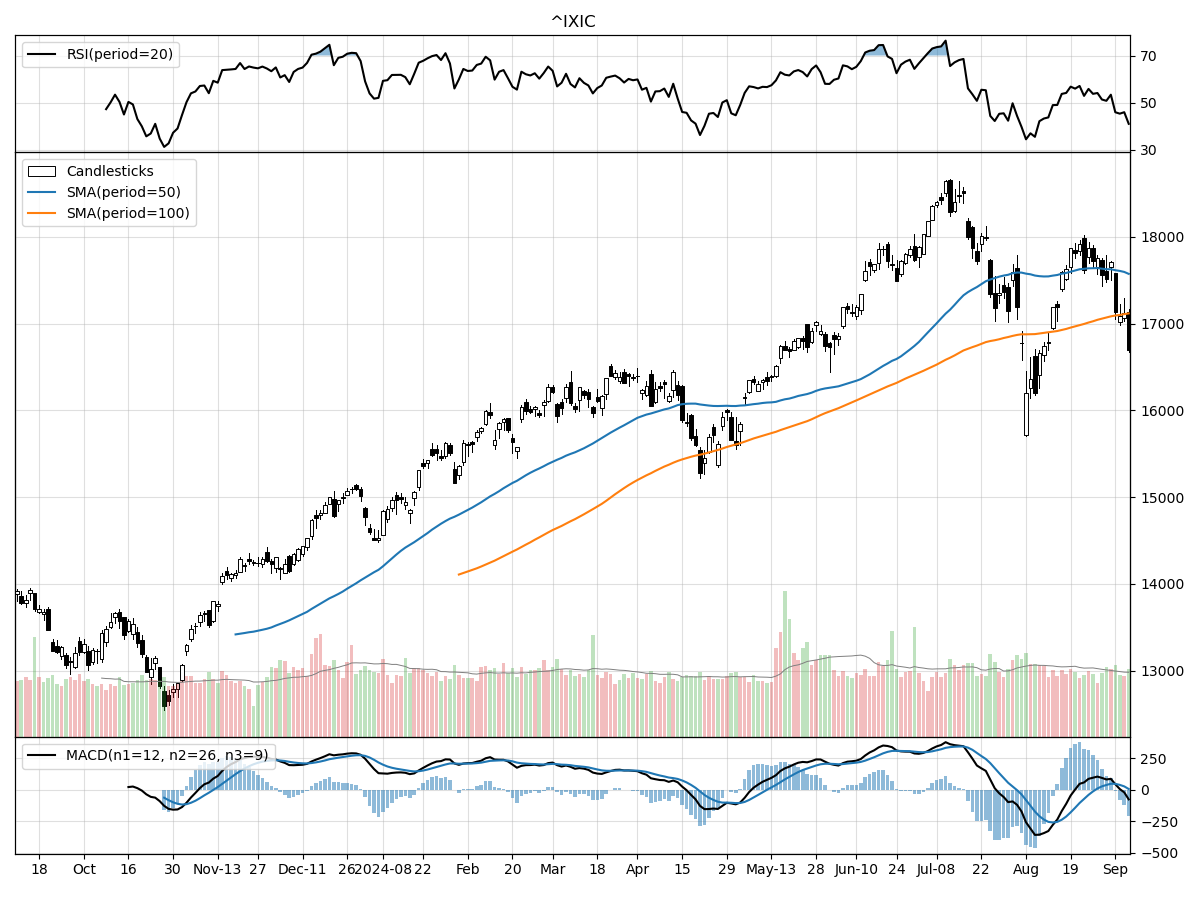
Nasdaq
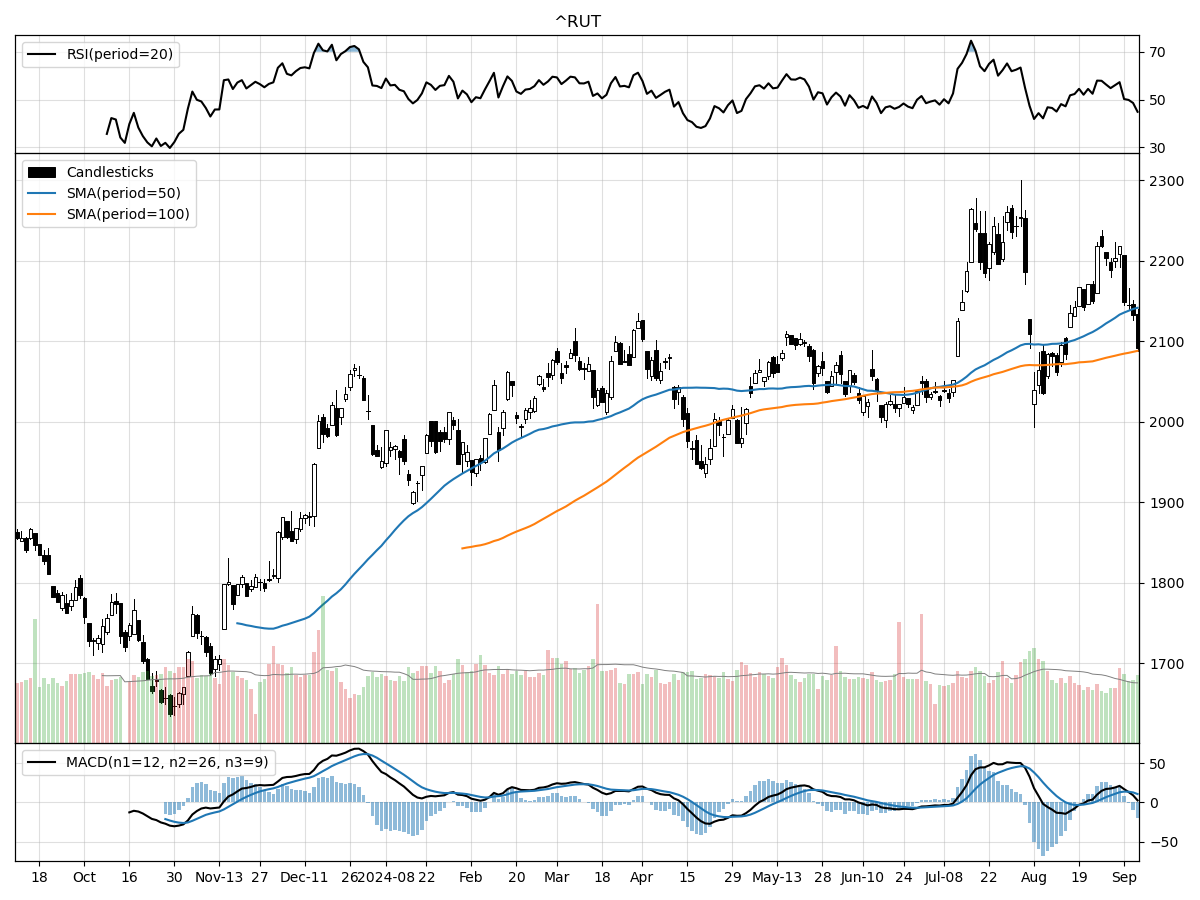
Russell 2000
Analyzing the recent technical performance of the S&P 500, Nasdaq, and Russell 2000 indices unveils a nuanced landscape for investors. The S&P 500, trading at 5408.42, remains relatively stable, hovering 31% above its 52-week low and just 4% below its 52-week high. While the index has not shown significant volatility over the past month or three months, it is under moderate selling pressure according to Money Flow indicators, which suggests some cautious sentiment among investors. However, the MACD remains bullish at 31.20, indicating a positive momentum could still be in play.
In contrast, the Nasdaq, currently priced at 16690.83, presents a slightly different picture. It stands 32% above its 52-week low but is 10% below its 52-week high, indicating a more pronounced recent pullback than the S&P 500. The Nasdaq has declined by approximately 5.2% over the past three months, which is significant compared to the stability seen in the S&P 500. Despite this, Money Flow indicators suggest moderate buying pressure, and the stock is under accumulation, hinting at potential investor confidence in a rebound. The MACD is also bullish at 7.062, adding a layer of optimism.
The Russell 2000, reflecting small-cap stocks, is trading at 2091.41 and is 27% above its 52-week low, with a 7% gap to its 52-week high. Similar to the S&P 500, the Russell 2000 has shown relative stability over recent months. However, it is under moderate selling pressure and distribution according to Money Flow indicators, contrasting the accumulation seen in the Nasdaq. The MACD remains bullish at 10.81, suggesting positive momentum, but the underlying distribution signals may warrant caution for potential investors.
Overall, while all three indices exhibit some bullish technical indicators, the Nasdaq shows a more dynamic recent performance with buying pressure despite a notable pullback, whereas the S&P 500 and Russell 2000 remain relatively stable but with signs of selling pressure. Investors would do well to consider these nuances when making investment decisions.
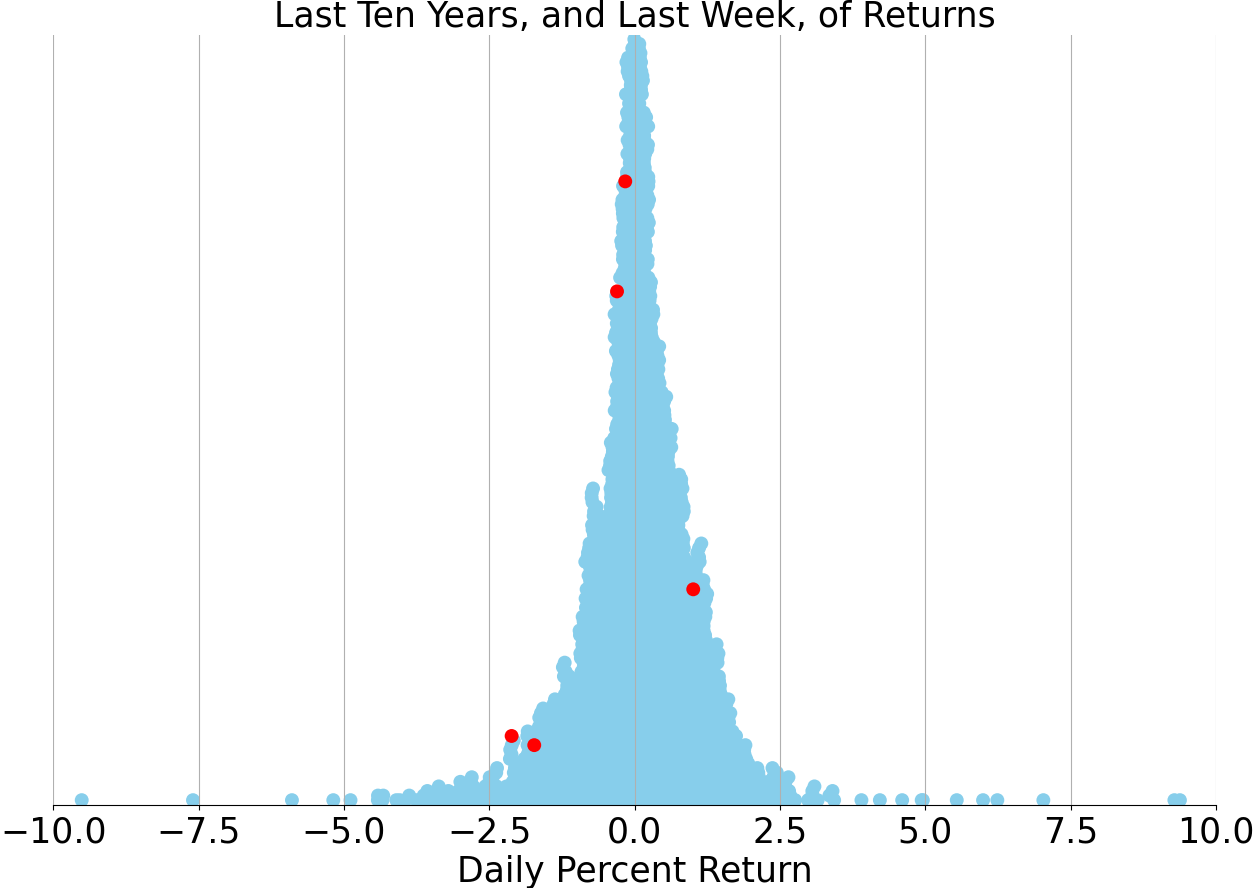
Last week vs. history (Large Cap S&P 500)
Market Commentary
In a week marked by a palpable shift in sentiment, the latest U.S. labor market data has painted a picture of a cooling economy. Job openings have dwindled to around 7.7 million, the lowest level this year, signaling a softening demand for labor. ADP's private employment data further underscored this trend, revealing the addition of just 99,000 new jobs, the weakest since 2021. This was further corroborated by the U.S. nonfarm jobs report, which fell short of expectations with 142,000 new jobs, below the anticipated 165,000. Revisions to the previous two months' figures shaved off an additional 86,000 jobs, bringing the three-month average to a more muted 116,000, a stark contrast to the robust average of 334,000 over the past three years.
Diving deeper into sector-specific trends, the manufacturing sector emerged as a significant weak spot, shedding 24,000 jobs against an expectation of losing just 2,000. This aligns with the ISM Manufacturing survey, which indicated continued contraction in the sector. On the other hand, the services economy, including leisure and hospitality, education and health services, and government sectors, saw the most significant job gains. However, even these sectors are not immune to the slowdown, with job growth figures trailing behind last year's numbers. This suggests that the peak job growth in services might be in the rearview mirror.
Despite the broader weakening trend, there were glimmers of optimism in the labor market. The unemployment rate ticked down from 4.3% to 4.2%, still above last year's low of 3.4% but well below the long-term average of 5.7%. Importantly, the rise in the unemployment rate has been largely driven by new entrants into the workforce rather than a spike in layoffs. While the 142,000 jobs added last month fell short of expectations, they remain in line with the pre-pandemic average of around 180,000, indicating that the labor market, while softening, is not yet in recessionary territory.
The market's reaction to these developments has been notably risk-averse, with defensive posturing evident across stock, bond, and commodities markets. Defensive sectors like consumer staples and utilities have surged ahead, while growth sectors such as technology and communication services have lagged. The bond market has also reflected this cautious stance, with the yield curve steepening as investors anticipate potential Federal Reserve rate cuts in response to the cooling economy.
Investor sentiment has been further dampened by the looming uncertainty in economic data and a natural pause following a strong market rally earlier this year. However, the market's current cautious stance could set the stage for positive surprises if upcoming economic data outperforms expectations. Historically, periods of weakened sentiment have often been followed by market recoveries when economic resilience is demonstrated.
A potential catalyst for improved market sentiment could come from the Federal Reserve. Fed Chair Jerome Powell's recent comments at the Jackson Hole symposium emphasized the central bank's focus on stabilizing the labor market. Given the recent labor market weakness, the Fed is poised to offer support, potentially through rate cuts. Analysts predict a 0.25% rate cut at the upcoming September 18 FOMC meeting, with the possibility of a more substantial 0.50% cut if market conditions worsen.
Next week's consumer price index (CPI) inflation readings will be closely watched as they represent the last major economic data before the Fed's September meeting. Expectations are for headline CPI inflation to continue its downward trend, moving closer to the Fed's 2.0% target. Easing inflationary pressures combined with lower interest rates could provide a much-needed boost to consumer and corporate spending, setting the stage for a potential economic reacceleration.
Despite the recent market sell-off, fundamentals still support a continued market expansion. Inflation is moderating, the Fed is likely to cut rates, and economic growth, while cooling, remains positive. For long-term investors, periods of market weakness may present buying opportunities, particularly in sectors poised to benefit from lower interest rates, such as utilities and industrials.
In conclusion, while the immediate outlook is marked by caution and uncertainty, the broader economic landscape still holds promise. Investors should remain vigilant but also be prepared to capitalize on opportunities that arise from market corrections. As always, diversification and a long-term perspective remain key strategies in navigating the current financial environment.
Stock study for Tuesday
Franklin Resources, Inc., operating under brand names like Franklin Templeton, Alcentra, and Legg Mason, is a global investment management organization managing approximately $1.4 trillion in assets. The company primarily generates revenue through investment management fees, which are influenced by the level and mix of assets under management (AUM) and the types of services provided. Franklin's asset management spans various classes, including fixed income, equity, alternatives, and multi-asset solutions. Recently, Franklin has agreed to acquire Putnam Investments, expected to close in the first quarter of fiscal year 2024, signaling potential growth in its asset base and service offerings.


Comments ()