
The Monday Charge: September 16, 2024
The Dow Jones Industrial Average has seen significant fluctuations, including a drop of 1,034 points on August 5, followed by a recovery of 1,062 points over the next six days.

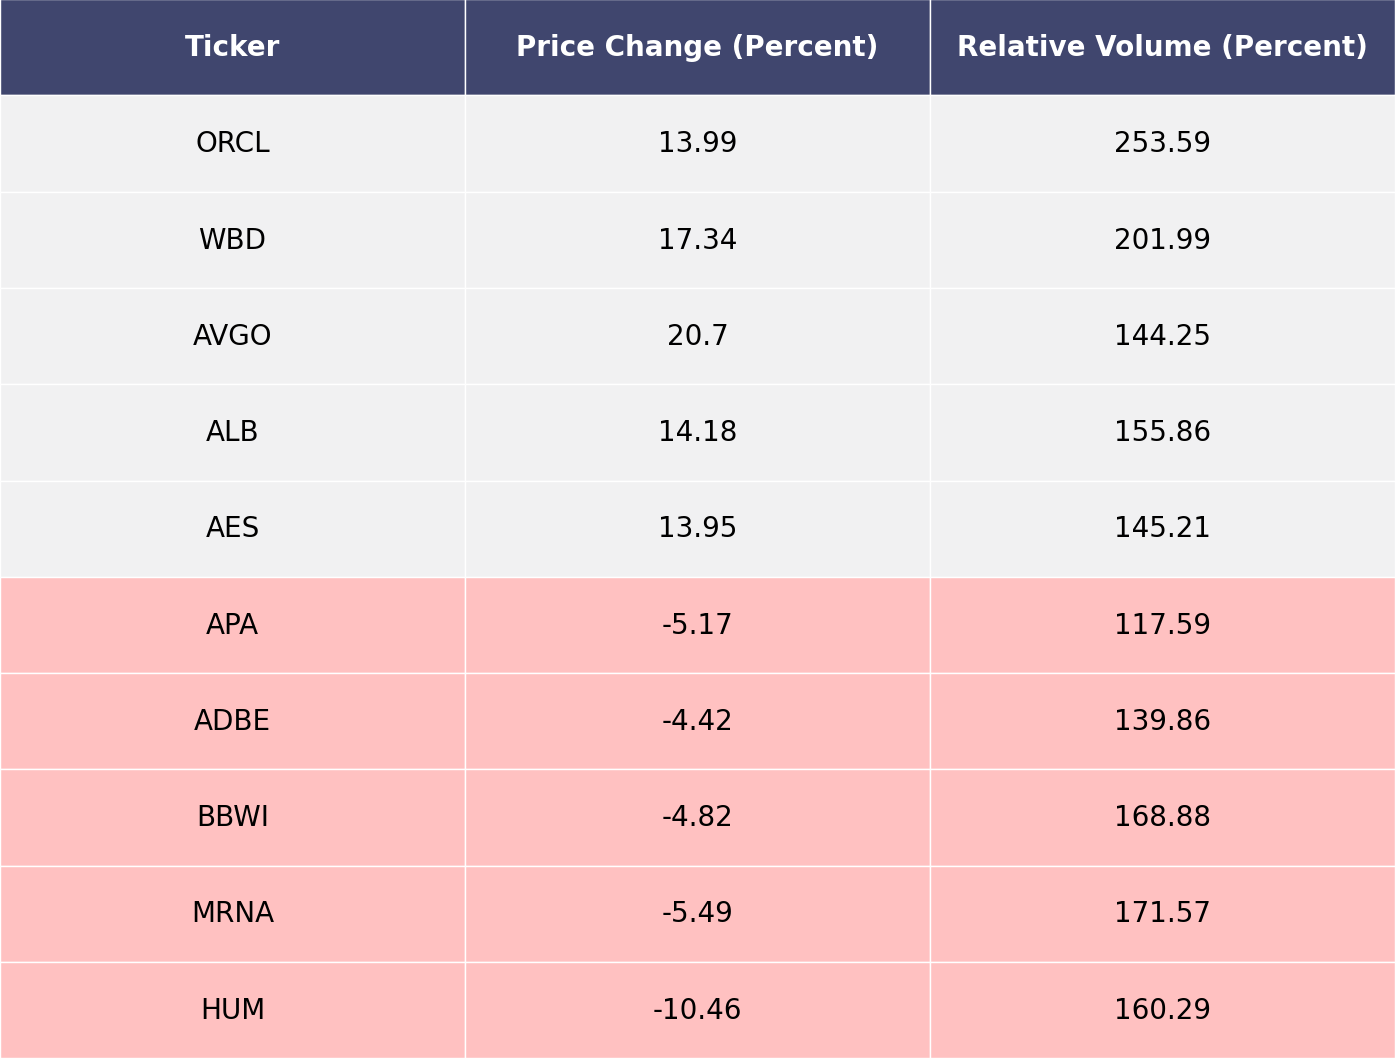
The biggest movers last week on price and volume (Large Cap S&P 500)
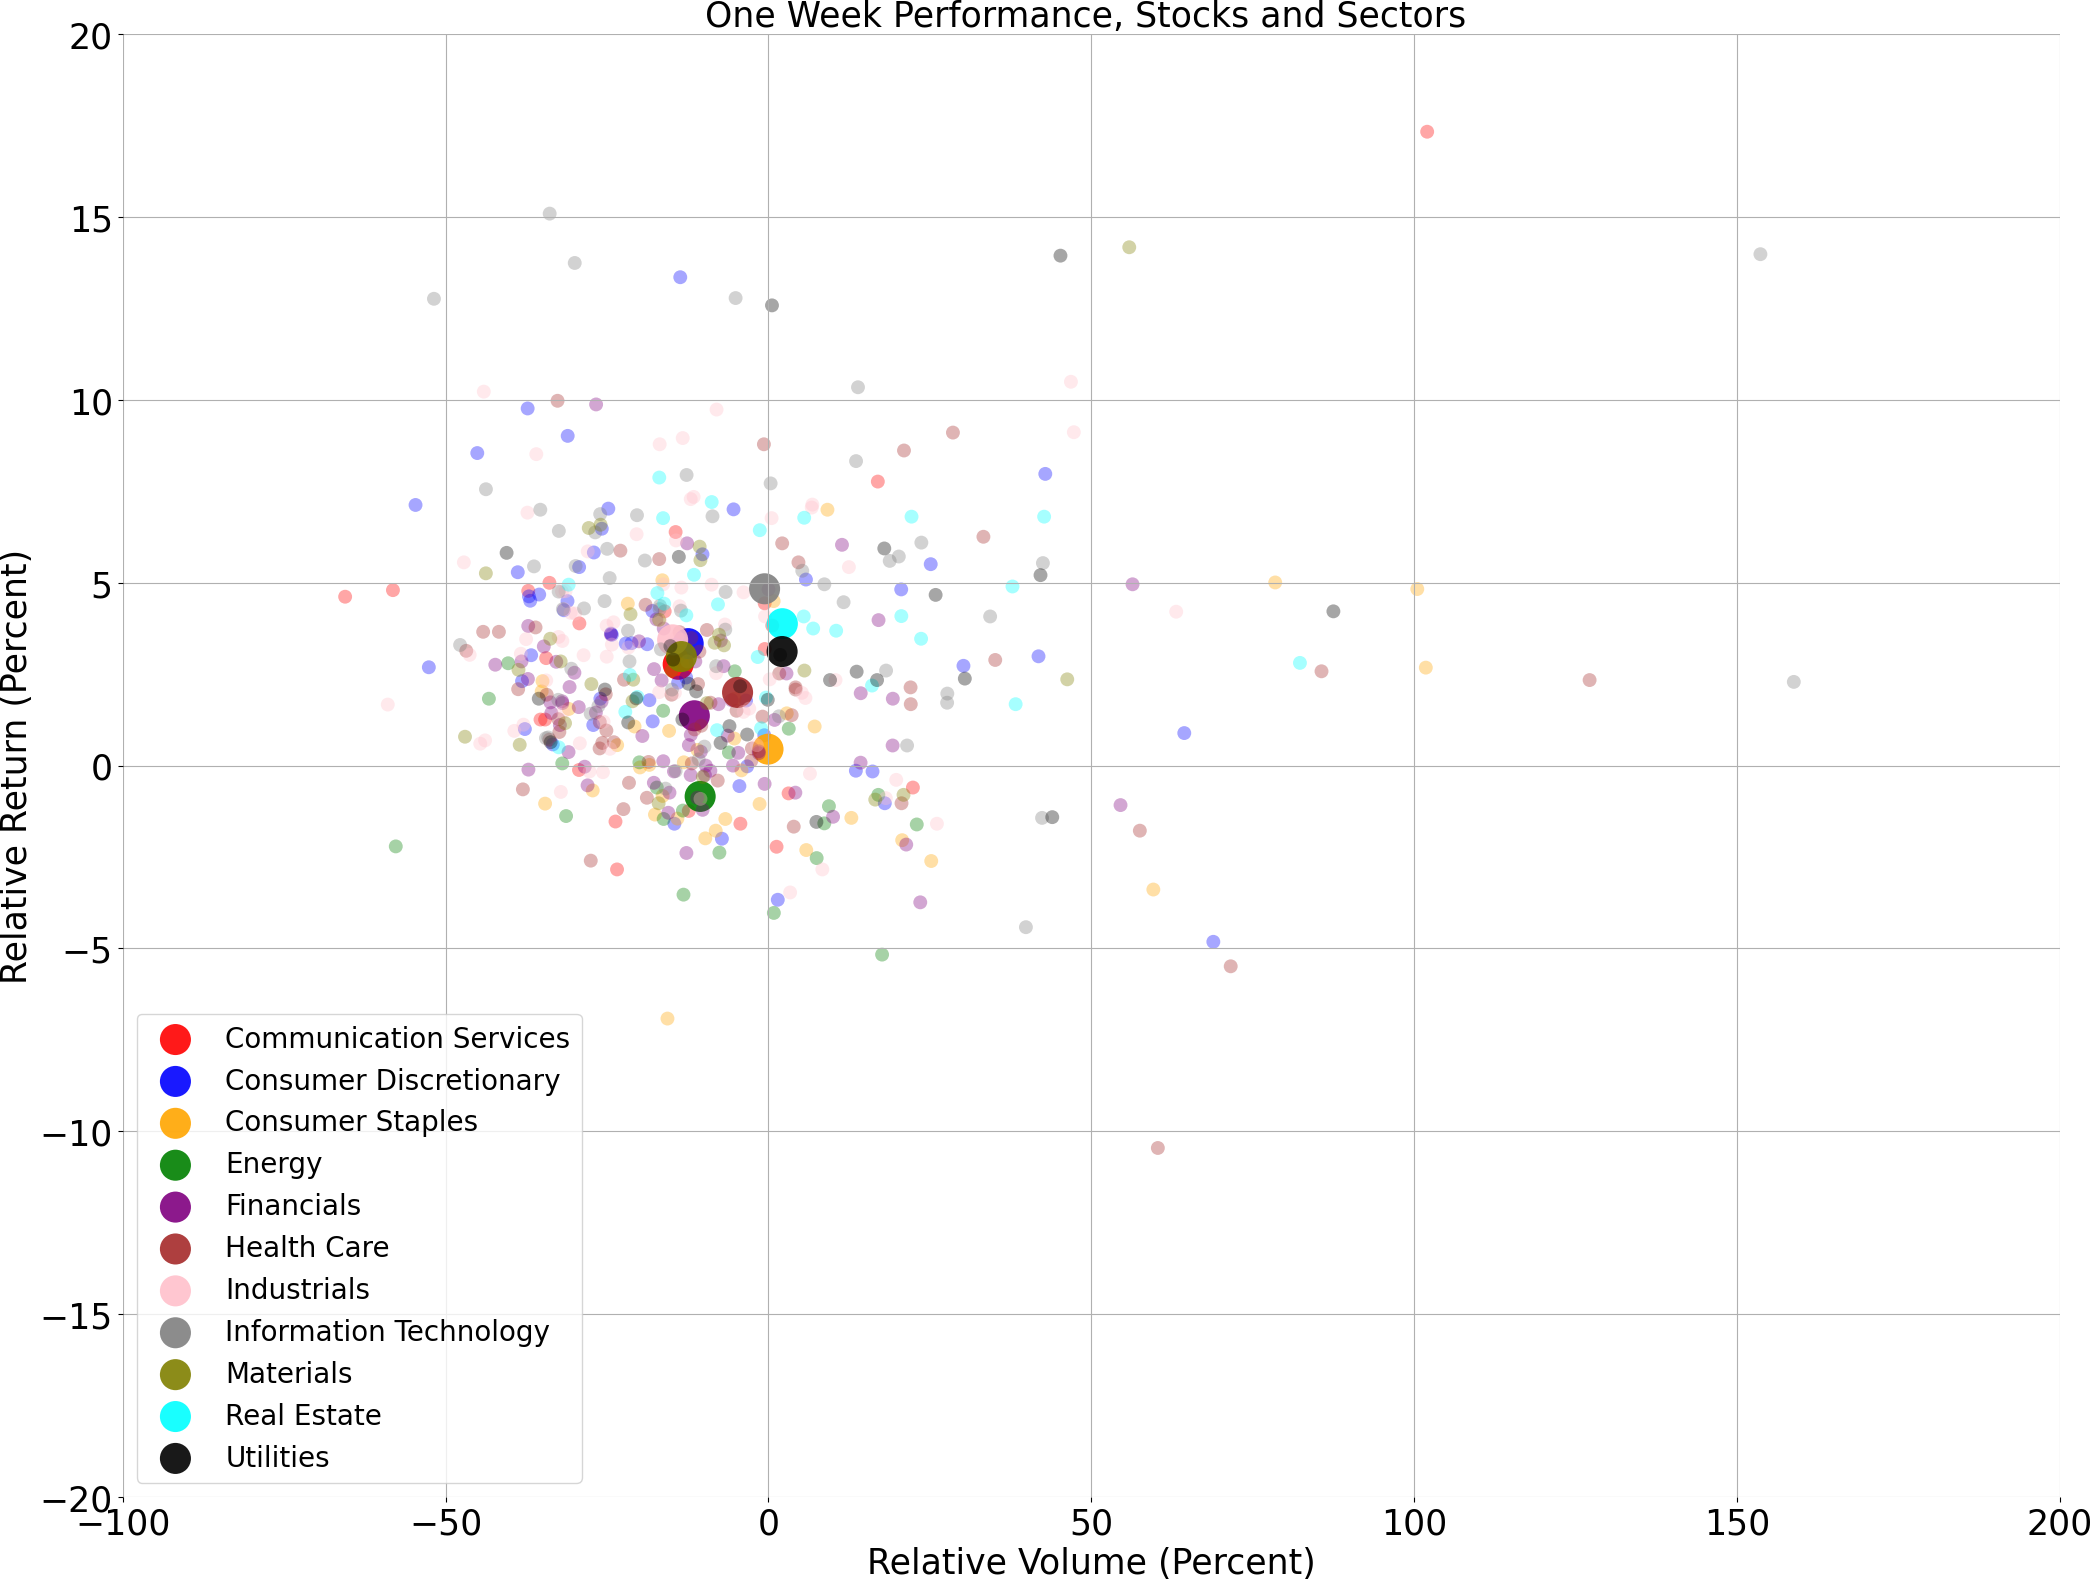
Price and volume moves last week for every stock and sector (Large Cap S&P 500)
A technical analysis across indices
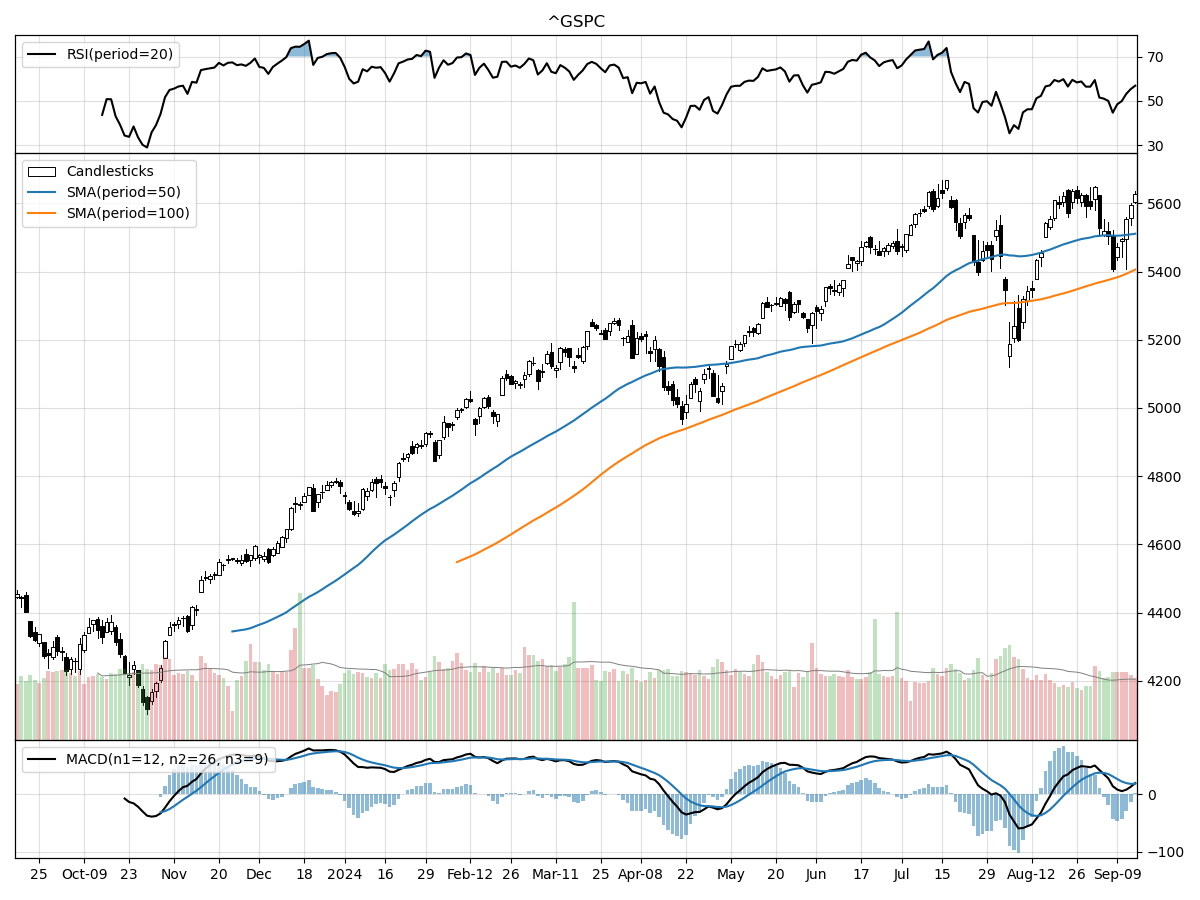
S&P500
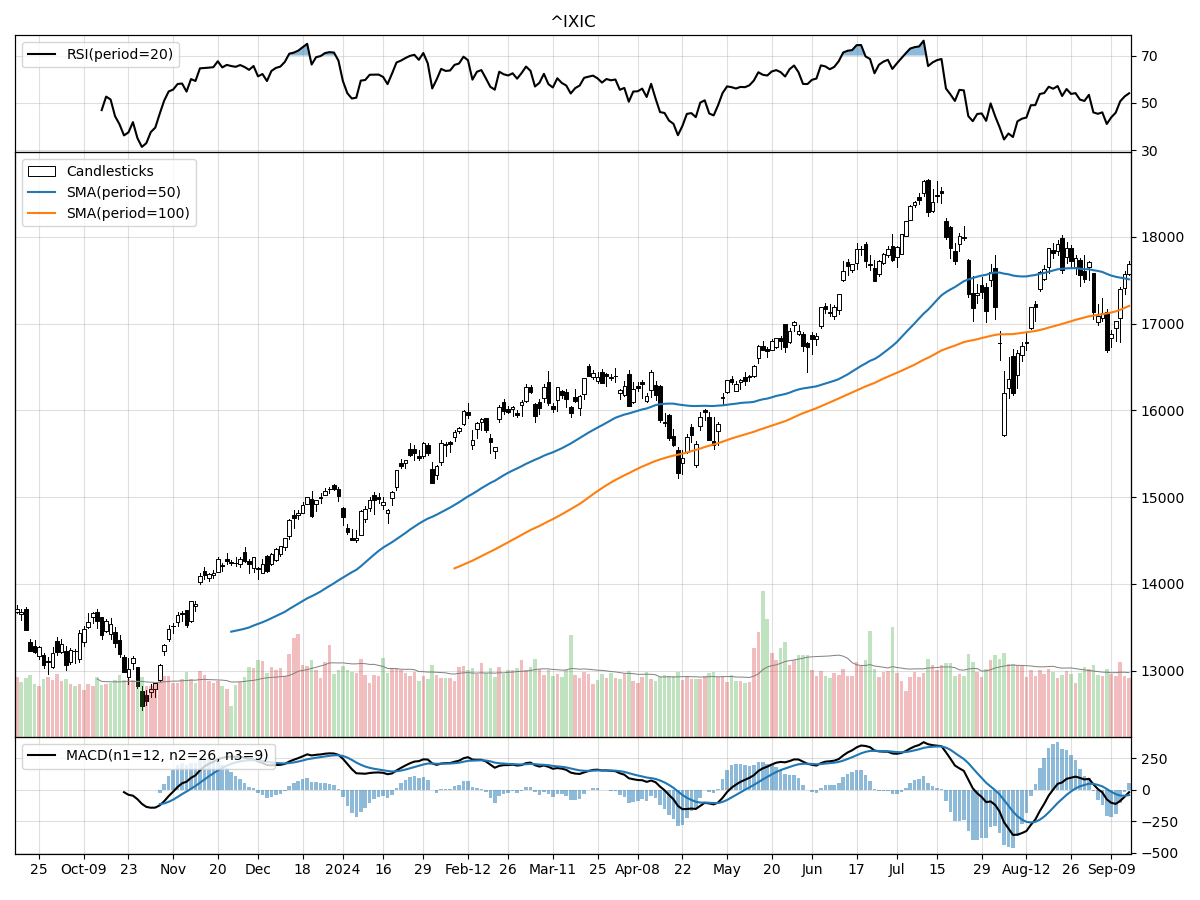
Nasdaq
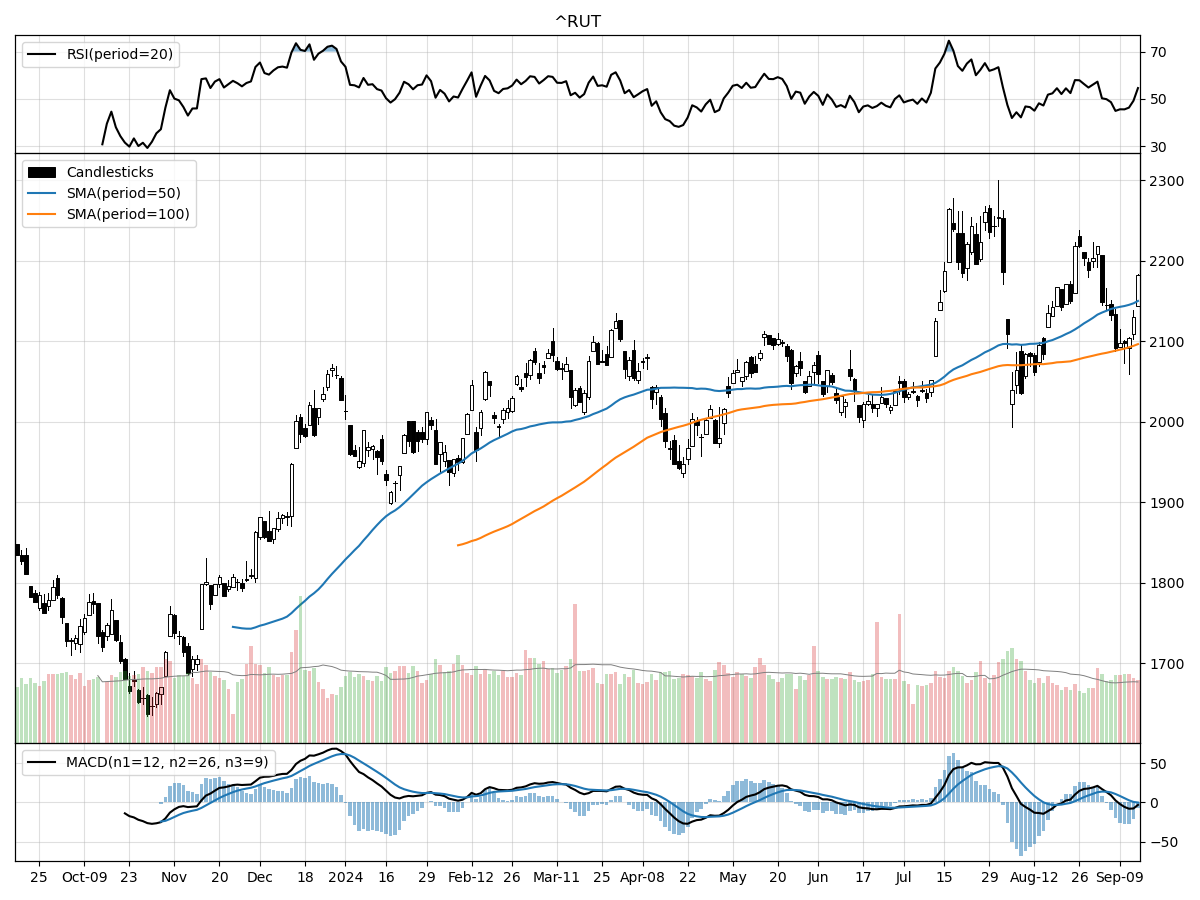
Russell 2000
Upon examining the technical performances of the S&P 500, Nasdaq, and Russell 2000 indices, there are several key observations to note. The S&P 500 is currently trading at its 52-week high, marking a 36% increase from its 52-week low. This suggests a strong performance over the past year, although recent price movements have been relatively stable, indicating a potential consolidation phase. The S&P 500 is under moderate buying pressure, has a bullish MACD of 18.52, and is neither overbought nor oversold according to RSI metrics. This positions the index as a potentially stable investment with a bullish outlook.
In contrast, the Nasdaq index, while also performing robustly with a 40% increase from its 52-week low, is 5% below its 52-week high. This indicates some recent pullback or resistance at higher levels. The MACD for the Nasdaq is bearish at -41.1, suggesting potential downside momentum. However, like the S&P 500, the Nasdaq is under moderate buying pressure and is not in an overbought or oversold condition. This mixed technical picture suggests that the Nasdaq might be facing some headwinds, but the accumulation signals indicate underlying investor confidence.
The Russell 2000 index, representing small-cap stocks, has shown a notable 8.18% rise over the last three months, outpacing the more stable performances of the S&P 500 and Nasdaq in the same period. Despite this recent uptrend, the Russell 2000 is 3% below its 52-week high and has shown moderate selling pressure, which could be indicative of profit-taking or less investor conviction at current levels. The MACD is slightly bearish at -0.08, but the index is also in an accumulation phase and is neither overbought nor oversold. This suggests that while the Russell 2000 has potential for growth, investors should be cautious of near-term volatility.
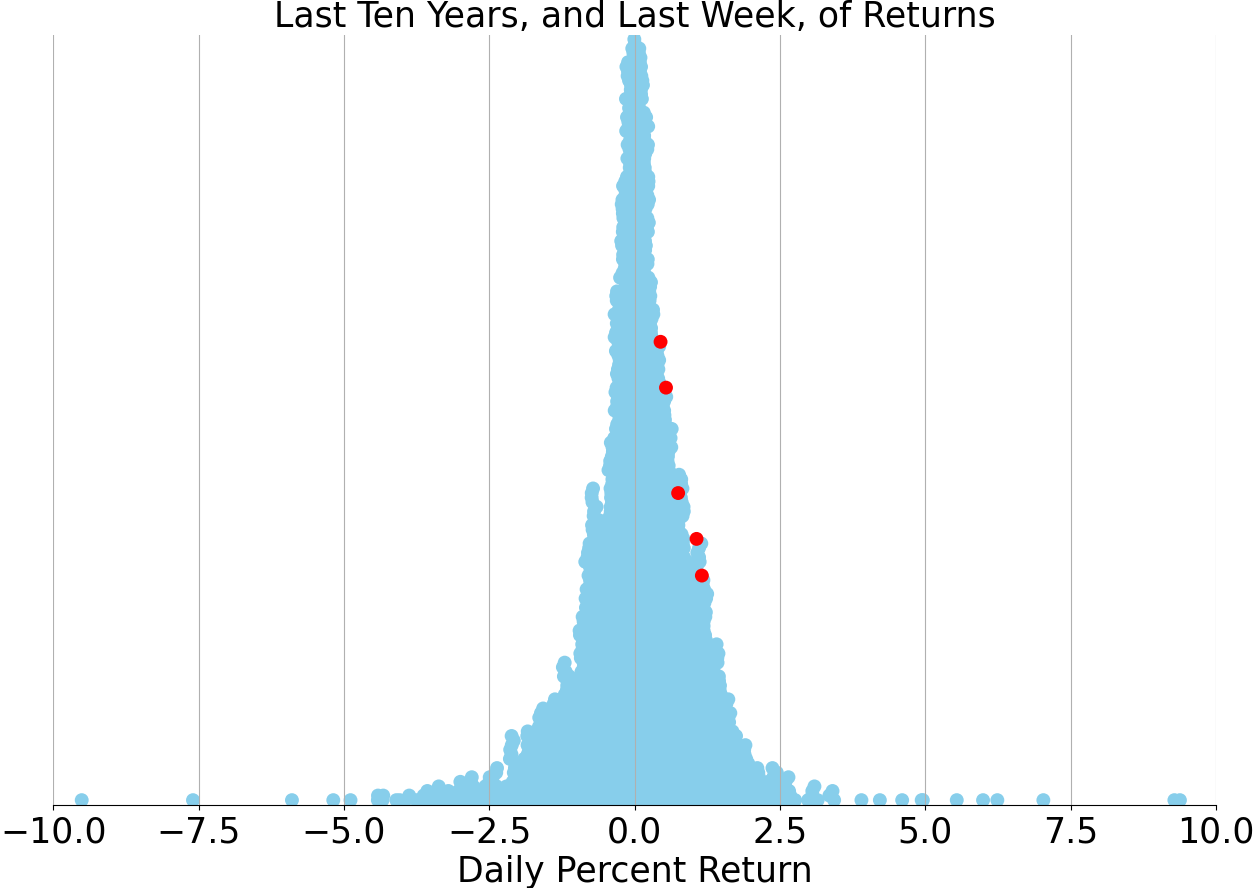
Last week vs. history (Large Cap S&P 500)
Market Commentary
In recent weeks, the financial markets have experienced a rollercoaster of volatility, driven by a mix of economic data and investor sentiment. The Dow Jones Industrial Average has seen significant fluctuations, including a drop of 1,034 points on August 5, followed by a recovery of 1,062 points over the next six days. This trend continued with nearly 2,000 points added in the following weeks, only to be offset by a 1,000-point decline from August 29 to September 6. Such dramatic swings underscore the market's sensitivity to economic indicators, particularly those related to labor and manufacturing.
The primary catalyst for these market gyrations has been a series of economic reports that have painted a mixed picture of the U.S. economy. Early August saw a sell-off triggered by a jobs report indicating a slowdown in hiring growth, raising fears of a potential recession. This was compounded by a weak manufacturing report later in the month, which further dampened investor confidence. The most recent bout of volatility was sparked by a consumer price index (CPI) report that showed a stall in the decline of inflation, leading to concerns about the Federal Reserve's next moves on interest rates.
Despite these short-term fluctuations, a broader perspective reveals a more resilient market. Investors have been quick to buy into dips, suggesting that recession fears may be overblown. The market's ability to recover quickly from downturns indicates underlying strength, bolstered by a tight labor market and strong performance from mega-cap tech stocks. This resilience suggests that while volatility may persist, the long-term outlook remains positive.
Zooming in on the latest inflation data, the core CPI held steady at 3.2% year-over-year, a figure that is both a sign of progress and a cause for concern. While this is significantly lower than the peak levels of inflation seen last year, it remains above the Federal Reserve's target of 2%. The primary driver of this stubborn inflation has been shelter costs, including rents and home prices, which rose by 0.5% month-over-month. Other categories, such as used vehicles and personal care, showed price declines, offering some hope for further moderation in inflation.
The Federal Reserve's policy response to these inflation trends will be crucial in shaping market expectations. While there was some speculation about a larger rate cut, the latest inflation data makes a 50-basis-point cut unlikely. Instead, a more modest 25-basis-point cut is expected at the upcoming Fed meeting on September 18. The market's initial reaction to the CPI report, which was less than enthusiastic, reflects the adjustment of expectations regarding the pace and scale of rate cuts.
Looking at the bigger picture, inflation has moderated significantly from its peak in 2022, allowing the Federal Reserve to consider easing its restrictive monetary policy. This anticipated shift has been a key driver of stock market gains over the past 18 months. However, the path to lower inflation is likely to be uneven, with potential hiccups along the way. Investors should be prepared for periods of volatility as the Fed calibrates its policy in response to incoming data.
Historical context provides some reassurance that rate cuts in a non-recessionary environment can be favorable for the stock market. Instances such as 1966, 1984, 1995, and 1998 show that markets have performed well following the start of a rate-cutting cycle when not accompanied by a recession. This historical precedent suggests that the current environment, characterized by moderating inflation and a strong labor market, could support continued market gains.
In summary, while recent market volatility has been unsettling, a broader view reveals a resilient market supported by strong fundamentals. Inflation is moderating, albeit slowly, and the Federal Reserve is likely to begin a cautious rate-cutting cycle. Investors should keep a wide lens on market trends, recognizing that short-term fluctuations are part of a longer-term positive trajectory. As always, diversification and a focus on long-term goals remain key strategies for navigating the financial landscape.
Stock study for Tuesday
ConocoPhillips (COP) is an independent exploration and production company operating in 13 countries, focusing on extracting and marketing crude oil, bitumen, natural gas, NGLs, and LNG. The company is organized into six segments: Alaska, Lower 48 (U.S.), Canada, Europe/Middle East/North Africa, Asia Pacific, and Other International. As of the end of 2023, ConocoPhillips employed around 9,900 people and produced 1,826 thousand barrels of oil equivalent per day. Significant growth projects include the Nuna and Coyote projects in Alaska and the Willow project, expected to start production in 2029. The Lower 48 segment is the largest, leveraging unconventional plays in the Delaware Basin, Eagle Ford, Midland Basin, and Bakken regions.


Comments ()