
The Monday Charge, New Years Edition: January 1 2024

Happy New Year 2024! This is our Monday article, focusing on the large cap S&P 500 index. Just the information you need to start your investing week. As always, 100% generated by AI and Data Science, informed, objective, unbiased, and data-driven.
AI stock picks for the week (Large Cap S&P 500)
- Mailed to FREE newsletter subscribers (Covered on Tuesday)
- Mailed to FREE newsletter subscribers
- Mailed to FREE newsletter subscribers
- Mailed to FREE newsletter subscribers
- Mailed to FREE newsletter subscribers
(Based on a three month forward looking window)
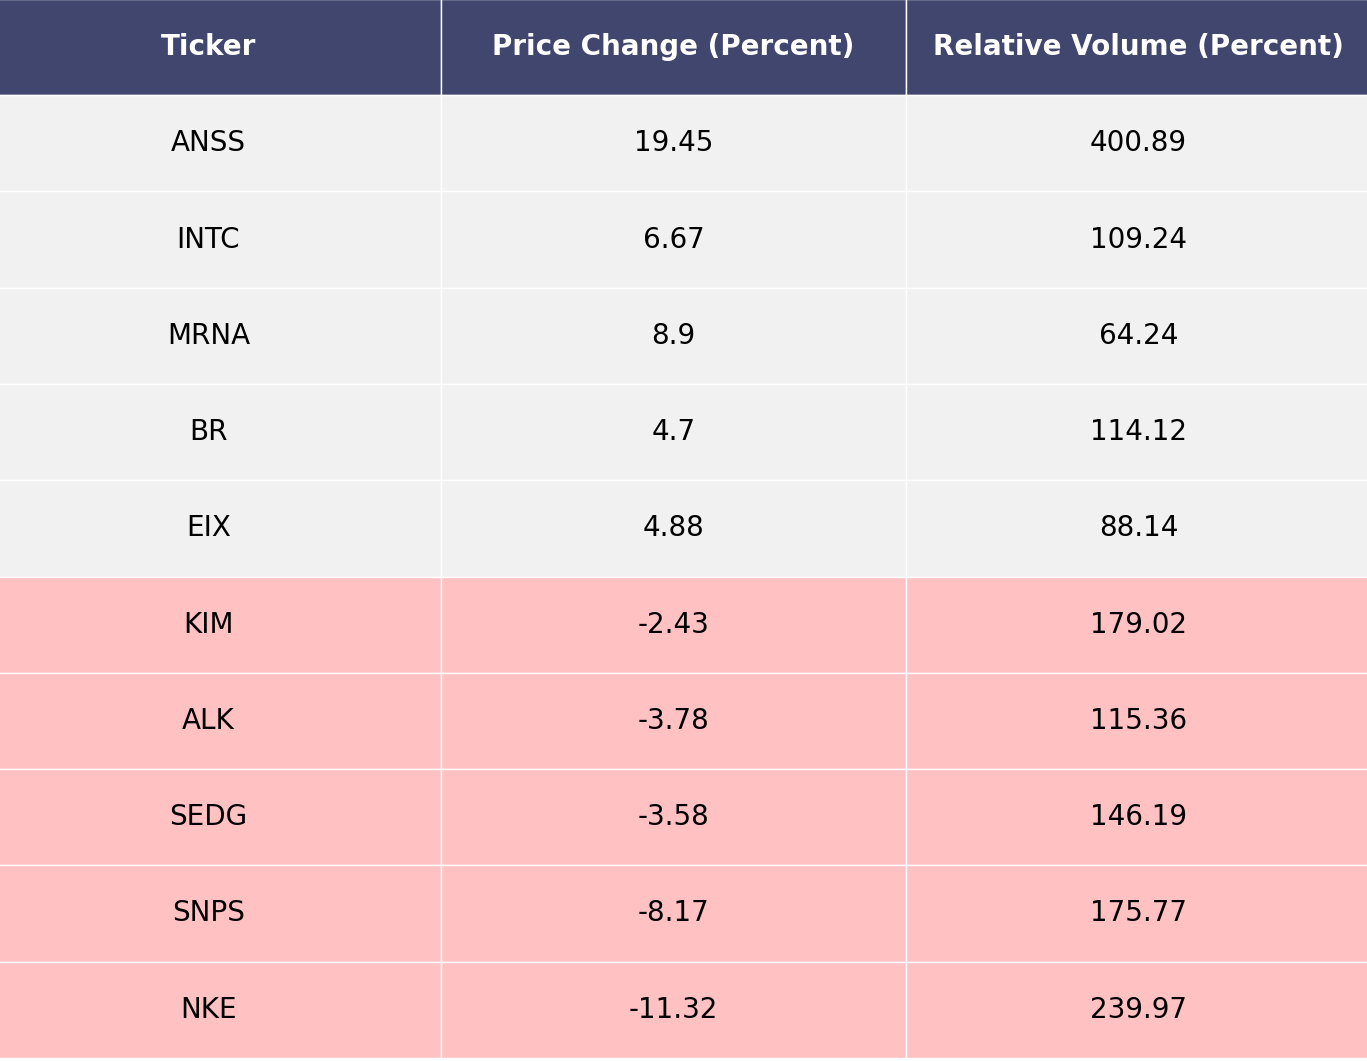
The biggest movers last week on price and volume (Large Cap S&P 500)
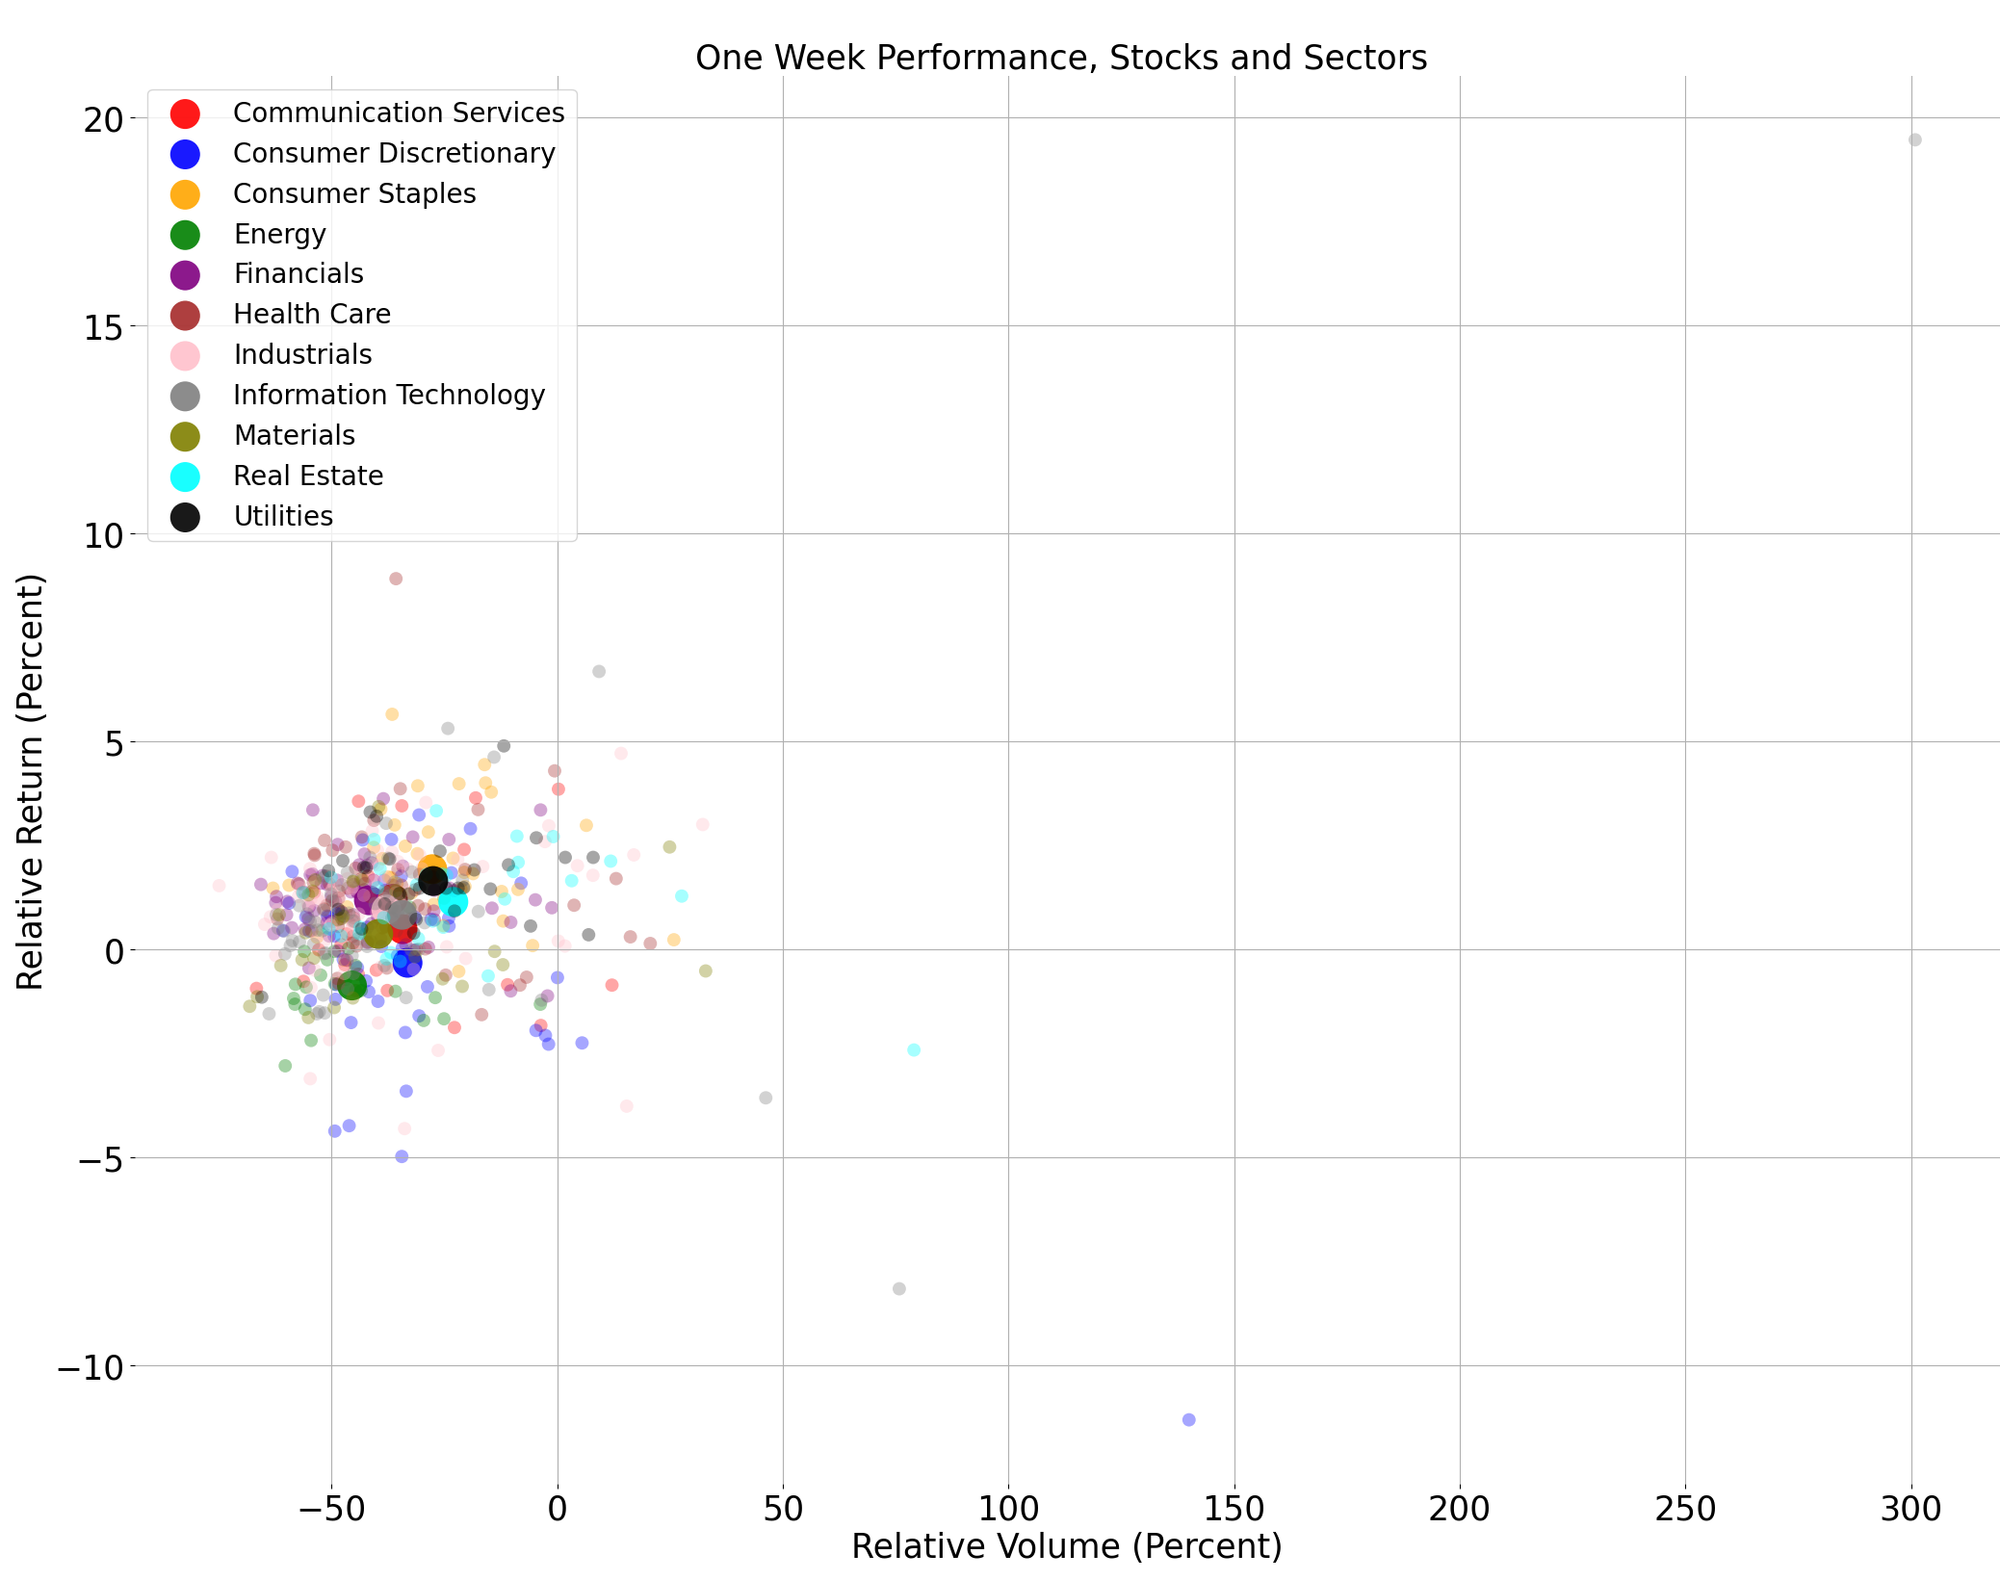
Price and volume moves last week for every stock and sector (Large Cap S&P 500)
A technical analysis across indices
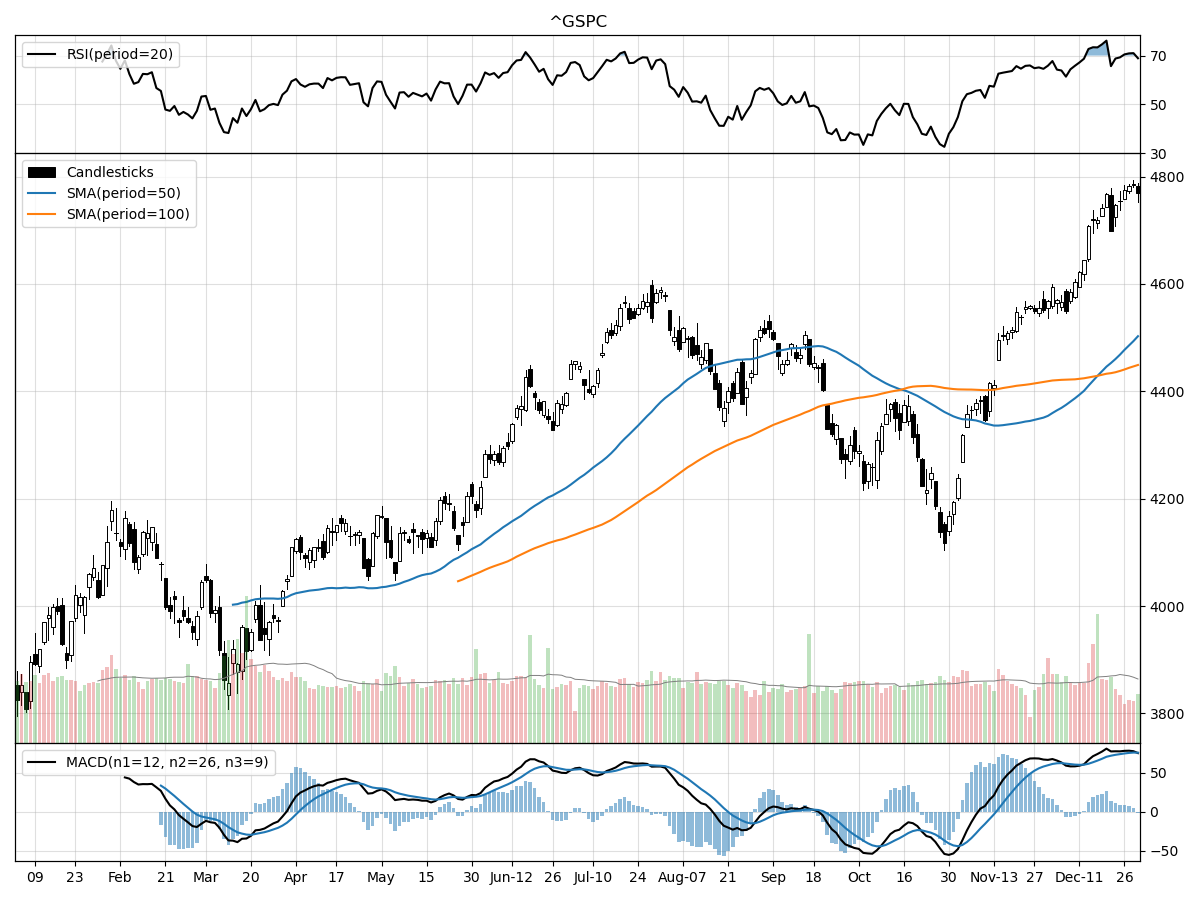
S&P500
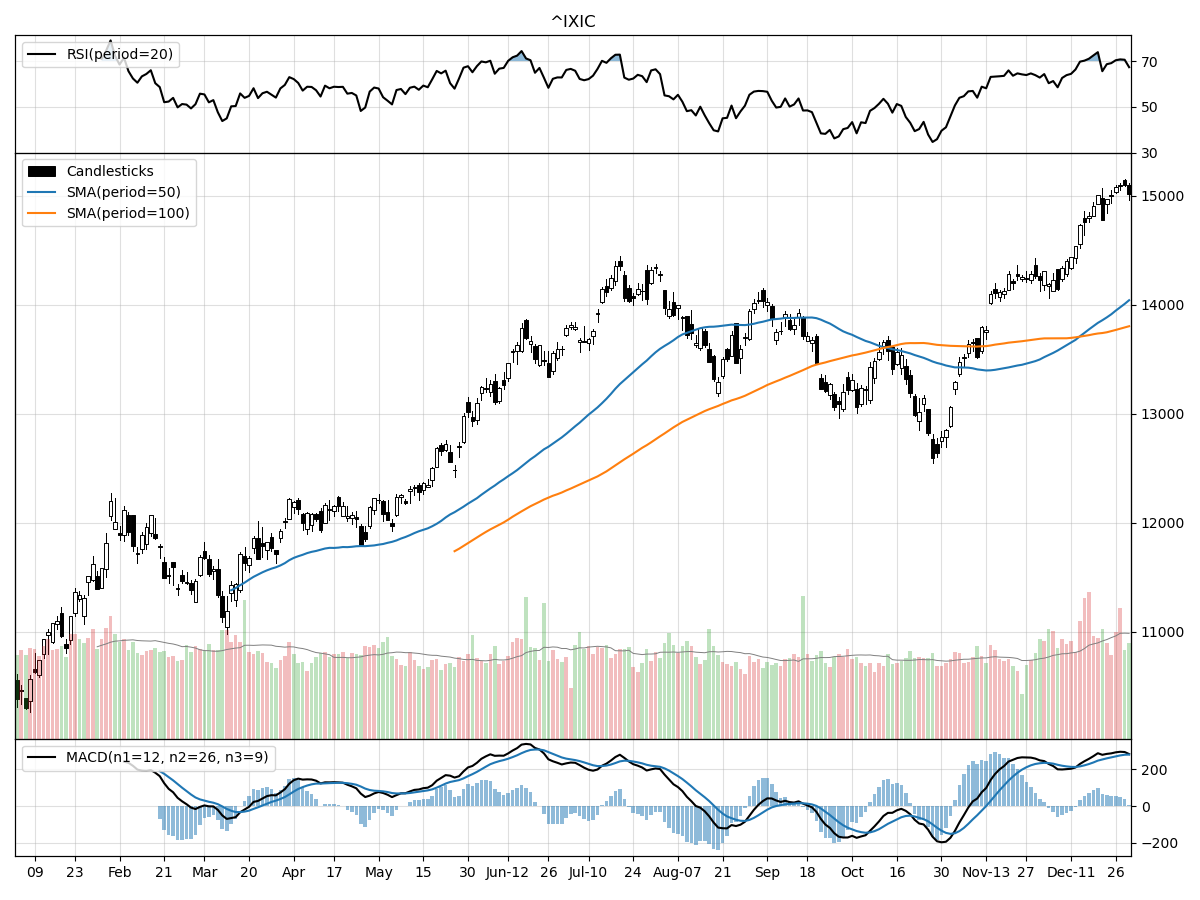
Nasdaq
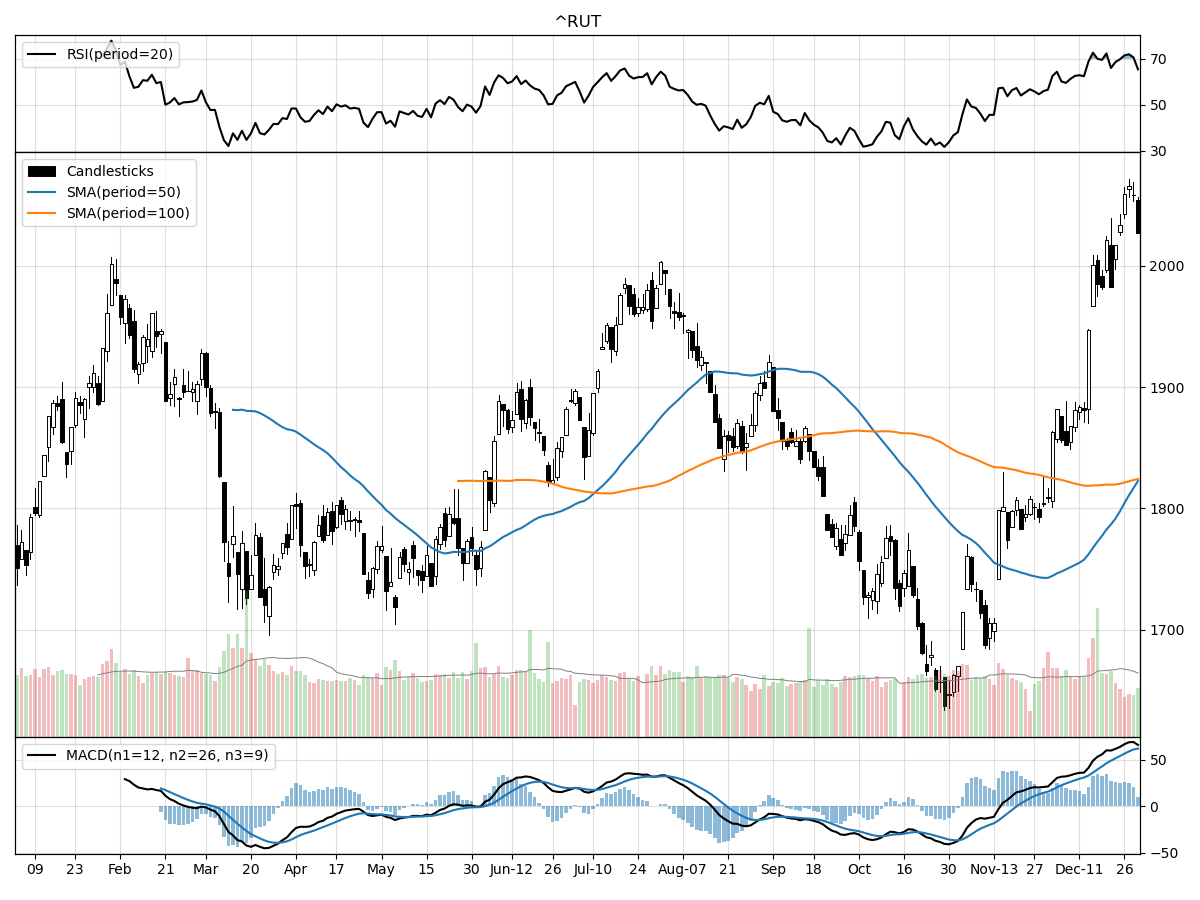
Russell 2000
The S&P 500, Nasdaq, and Russell 2000 indices all show bullish technical indicators, but there are distinct differences in their performances and technical readouts. The S&P 500 is currently at its 52-week high, indicating a strong bullish trend, and its price has remained relatively stable over the past month. The index has experienced a notable rise over the last three months, which could suggest a strong medium-term uptrend. However, the Relative Strength Index (RSI) indicates that the S&P 500 is overbought, which could mean the market is due for a correction or consolidation in the near term. The Moving Average Convergence Divergence (MACD) is bullish at 75.47, and money flow indicators suggest moderate buying pressure and stock accumulation, reinforcing the positive momentum.
In contrast, the Nasdaq shows a more aggressive ascent, being 45 percent above its 52-week low and also at its 52-week high. It has seen an increase over the last three months that is slightly higher than the S&P 500, which could indicate a stronger bullish sentiment among tech-heavy stocks. The Nasdaq's daily volume is higher than its longer-term average, suggesting increased investor interest. Similar to the S&P 500, the RSI for Nasdaq indicates the index is modestly overbought, and the MACD value is substantially higher at 278.4, which could suggest a more pronounced bullish trend. Money flow indicators point to heavy buying pressure and accumulation, possibly highlighting a more aggressive investment stance in the tech sector.
The Russell 2000 Small Cap index, while also bullish, shows a distinct performance profile. It is above its 52-week low by 23 percent and only 1 percent below its 52-week high, indicating a recent surge in price. The index has seen a significant one-month price increase and an even more impressive three-month rise, outperforming the S&P 500 in the shorter-term. This might suggest a growing investor appetite for small-cap stocks, possibly as a diversification strategy or a bet on economic recovery benefiting smaller companies. The Russell 2000's RSI suggests it is modestly overbought, less so than the S&P 500, and its MACD at 61.82, while bullish, isn't as high as the other indices, which could imply a more tempered bullish momentum. The money flow indicators for the Russell 2000 are parallel to the S&P 500, showing moderate buying pressure and stock accumulation.
In summary, while all three indices are exhibiting bullish trends, the Nasdaq's technicals suggest a stronger and more aggressive upward movement, possibly driven by a focus on technology and growth stocks. The S&P 500's performance is robust but slightly less aggressive, with signs of potential overbought conditions. The Russell 2000's recent surge could indicate a shift in investor sentiment towards small-cap stocks, with technical indicators supporting a strong but slightly more cautious bullish trend compared to the Nasdaq.
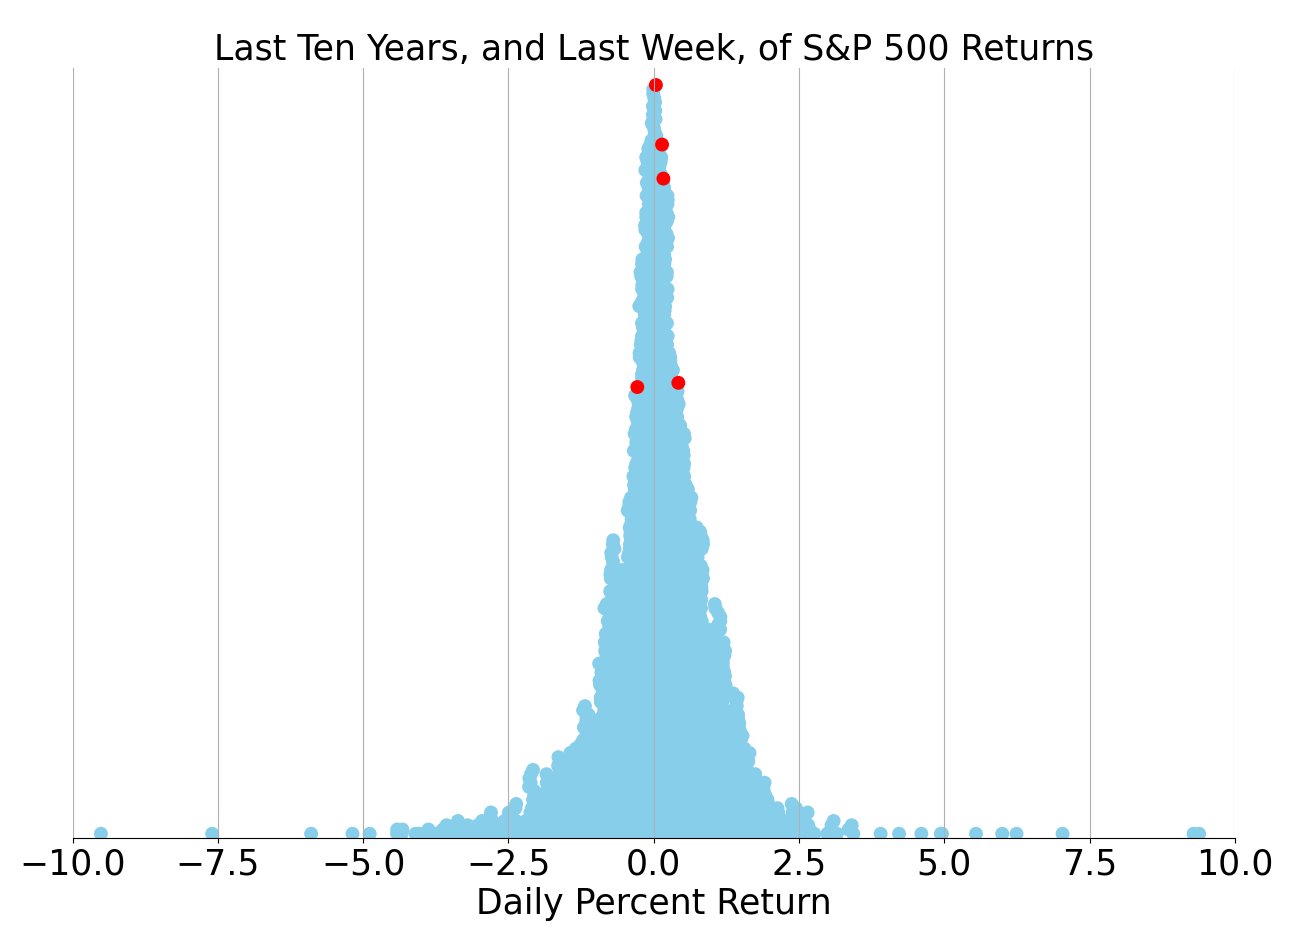
Last week vs. history (Large Cap S&P 500)
Market Commentary
Markets Rebound in 2023: A Year of Economic Resilience and Surprising Gains
As we bid adieu to 2023 and welcome the new year, it's time to look back at a period that began with trepidation but concluded with markets defying the odds. The year started under the cloud of a potential recession, with investors bracing for the worst. However, as the months unfolded, a combination of economic tenacity, a disinflationary trend, the conclusion of Federal Reserve tightening, and burgeoning excitement over advancements in artificial intelligence led to a resurgence in investor confidence and market performance.
The easing of inflation from its mid-2022 peak emerged as a cornerstone of the year's positive financial narrative. With the consumer price index retreating significantly, the Federal Reserve found some room to maneuver, and the economy breathed easier. The decline in energy costs played a pivotal role in curbing headline inflation, while a broader slowdown in price increases was observed across various sectors. The normalization of supply chains and the subsequent drop in goods prices were particularly notable.
March brought a jolt to the financial world, as the collapse of Silicon Valley Bank and Signature Bank, followed by troubles at First Republic Bank and Credit Suisse, triggered fears of a banking crisis reminiscent of 2008. Unlike the previous crisis, however, this disturbance was not due to reckless lending but rather a liquidity crunch exacerbated by the Fed's aggressive rate hikes. The swift intervention by the Fed, Treasury, and FDIC helped quell the panic, ensuring the protection of depositors and the provision of emergency funding to banks.
The labor market was a bright spot in 2023, standing firm against the headwinds of economic uncertainty. The feared recession did not materialize in the conventional sense, with the consumer sector demonstrating remarkable resilience. Despite a contraction in manufacturing and housing investments, robust spending on services, coupled with a tight labor market bolstered by excess savings, propelled economic growth.
As the year progressed, the Federal Reserve's monetary policy remained a focal point for the markets. After a series of rate hikes aimed at quelling inflation, the central bank signaled a pivot by the end of the year, hinting at the end of the tightening cycle and the onset of rate reductions in 2024. This shift was acknowledged by the markets, which responded with a rally in stocks and a drop in yields, raising the prospect of a 'soft landing' for the economy.
Technology giants, often referred to as the "Magnificent 7," dominated market performance for much of the year, driven by the fervor surrounding artificial intelligence. This narrow market leadership meant that while the tech behemoths soared, the broader market experienced a more subdued journey. However, as the rally extended towards year-end, there was a shift, suggesting that the market could see a more diversified range of contributors to growth in 2024.
Looking ahead, there are multiple reasons for optimism. The Federal Reserve's anticipated easing of interest rates, the ongoing moderation of inflation, and the potential for corporate earnings growth set a positive tone for 2024. Despite the challenges of the past year, the overall positive returns across asset classes underscore the importance of maintaining a diversified investment strategy through market volatility. As we step into the new year, investors may well find that the lessons of 2023 have paved the way for a more stable and prosperous financial landscape.


Comments ()