
The Monday Charge: May 6, 2024
As the financial markets transition from a period of robust gains, which began last November, to a more tumultuous phase...

This is our Monday article, focusing on the large cap S&P 500 index. Just the information you need to start your investing week. As always, 100% generated by AI and Data Science, informed, objective, unbiased, and data-driven.
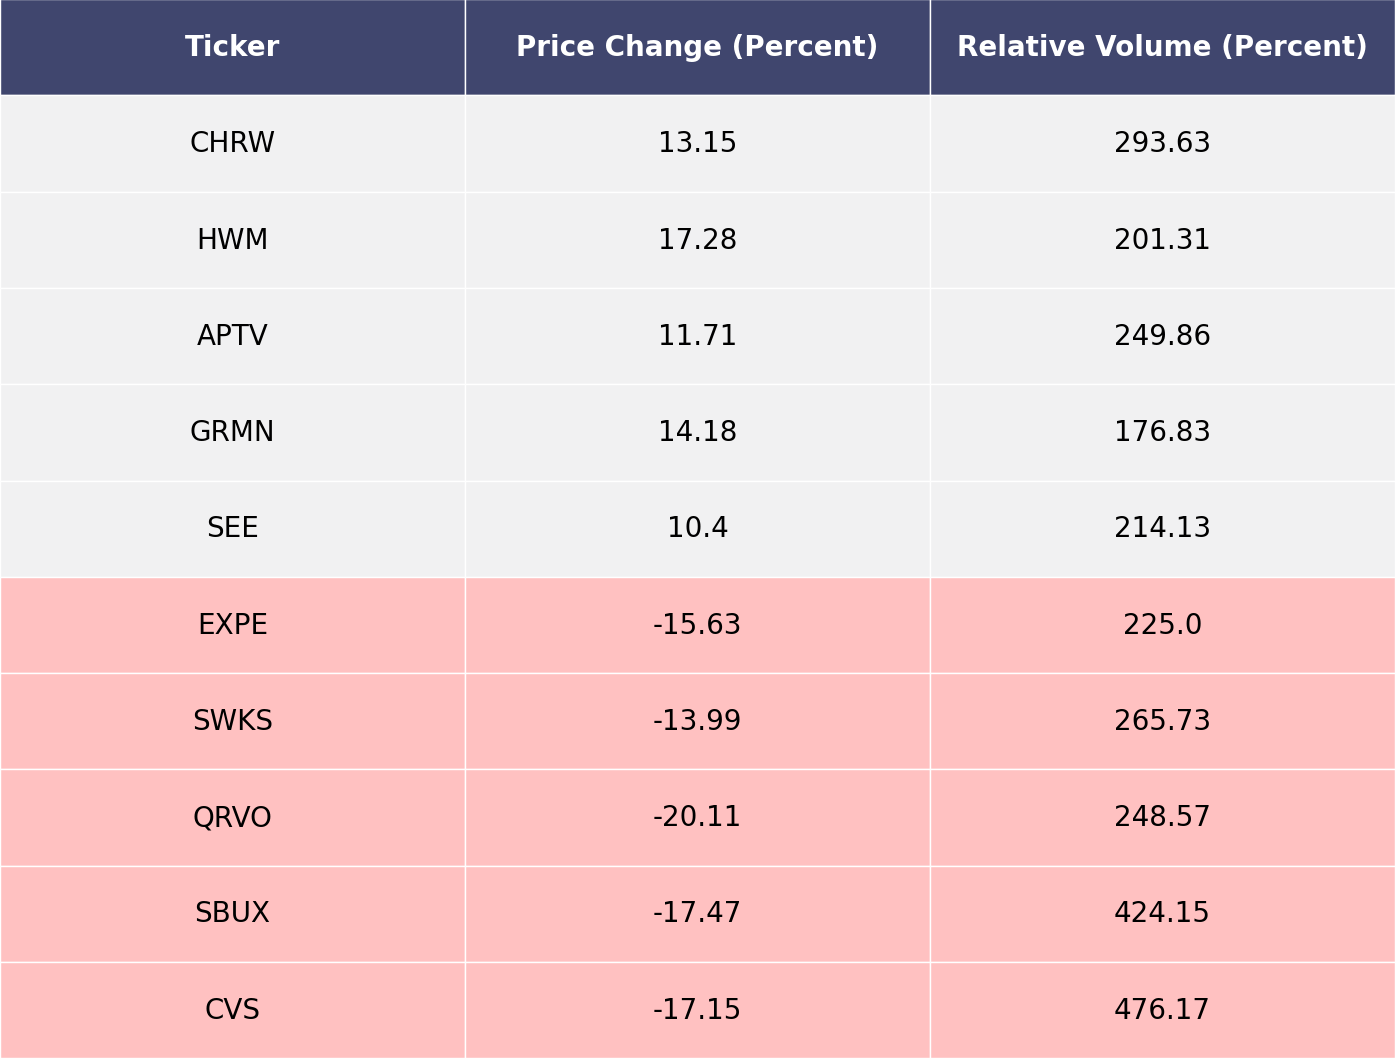
The biggest movers last week on price and volume (Large Cap S&P 500)
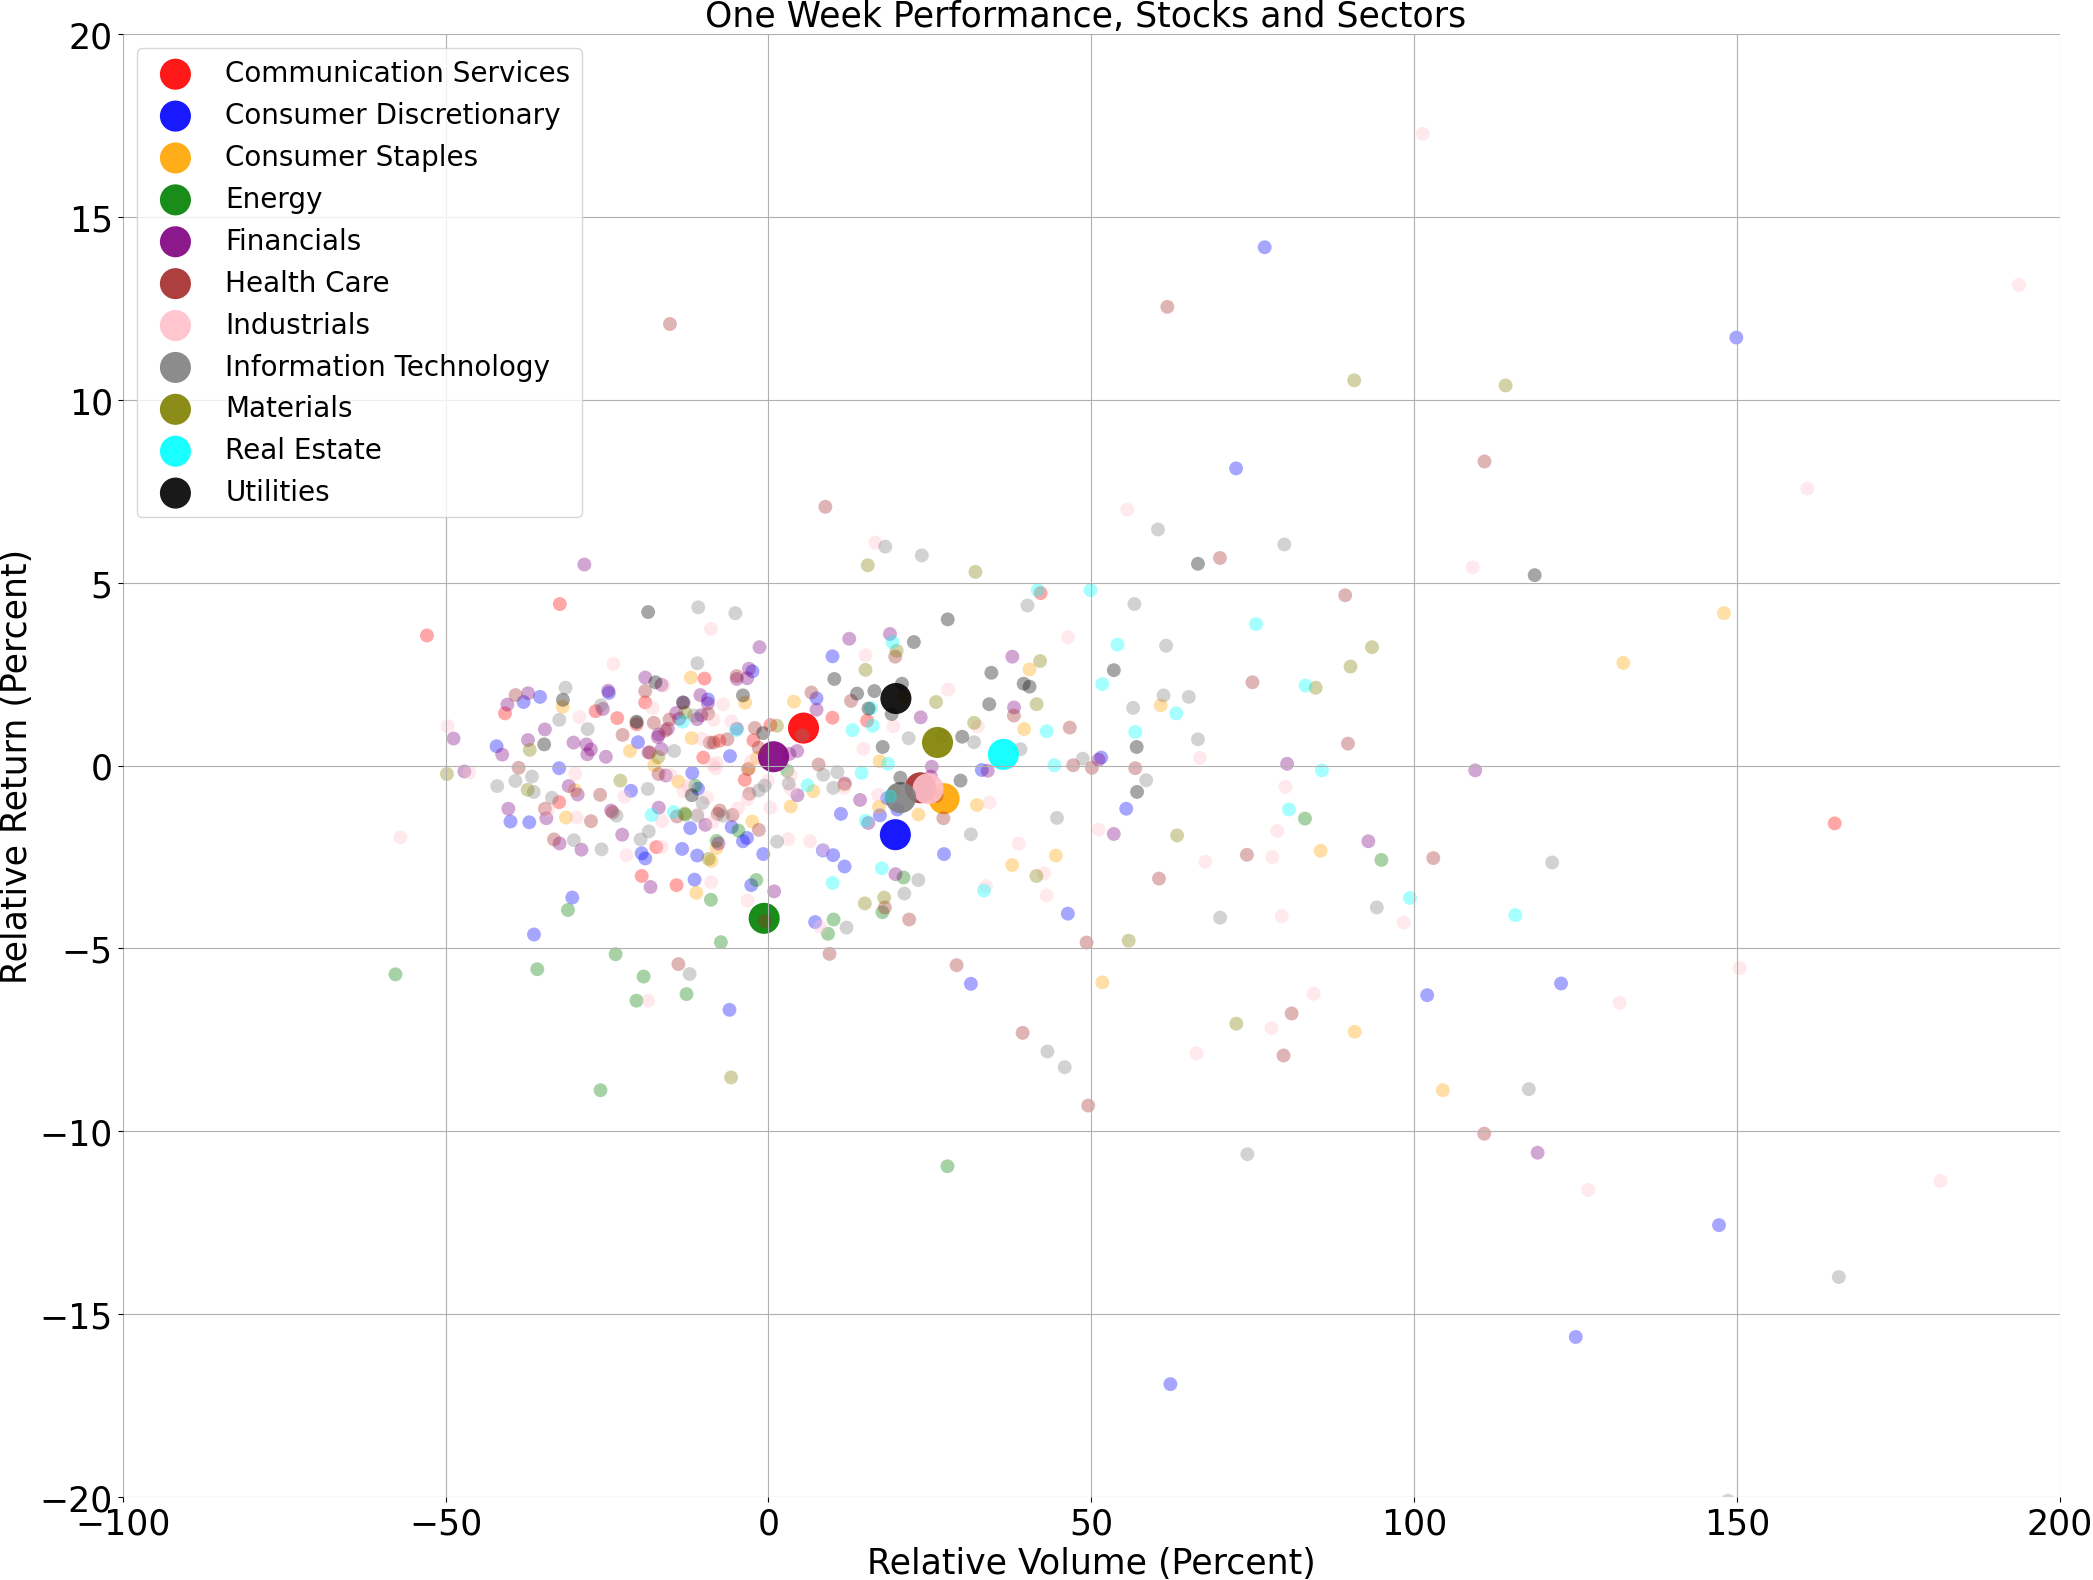
Price and volume moves last week for every stock and sector (Large Cap S&P 500)
A technical analysis across indices
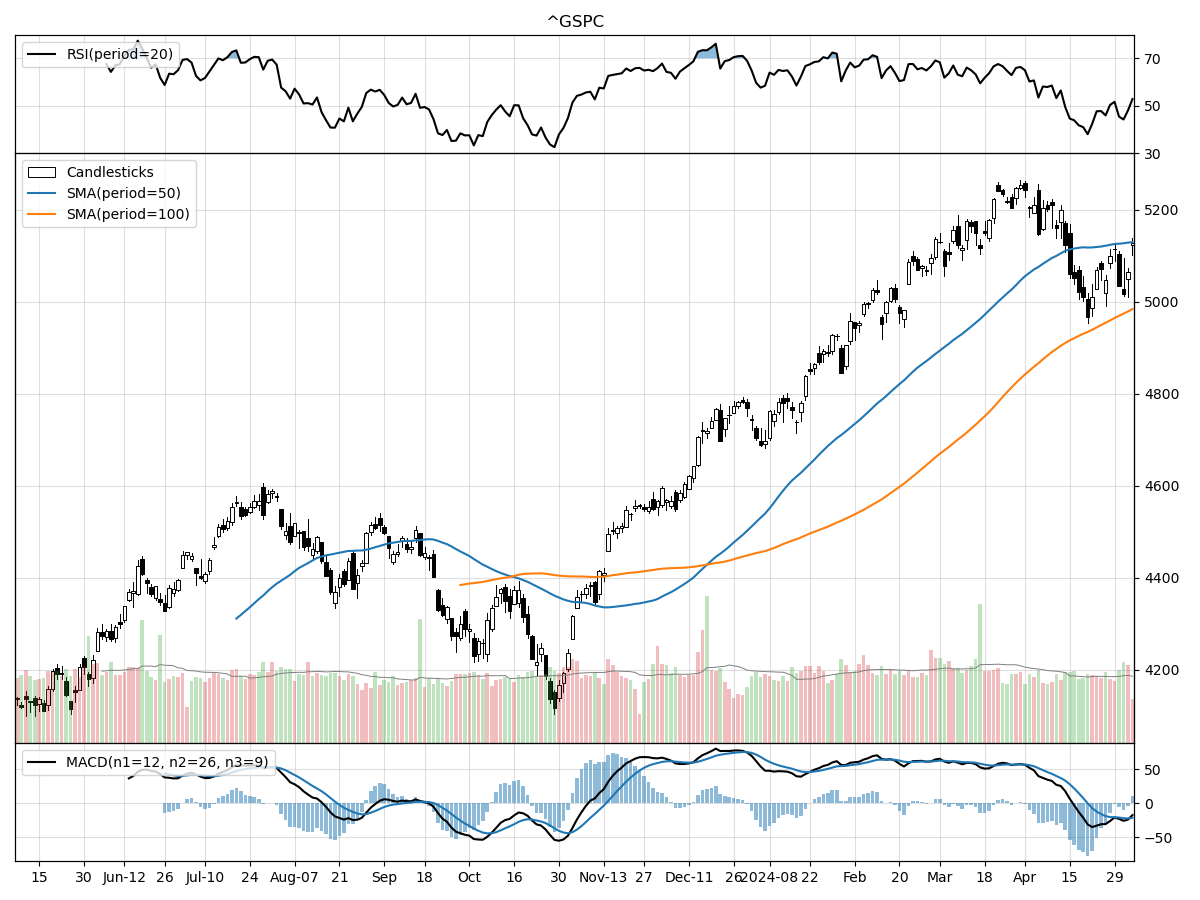
S&P500
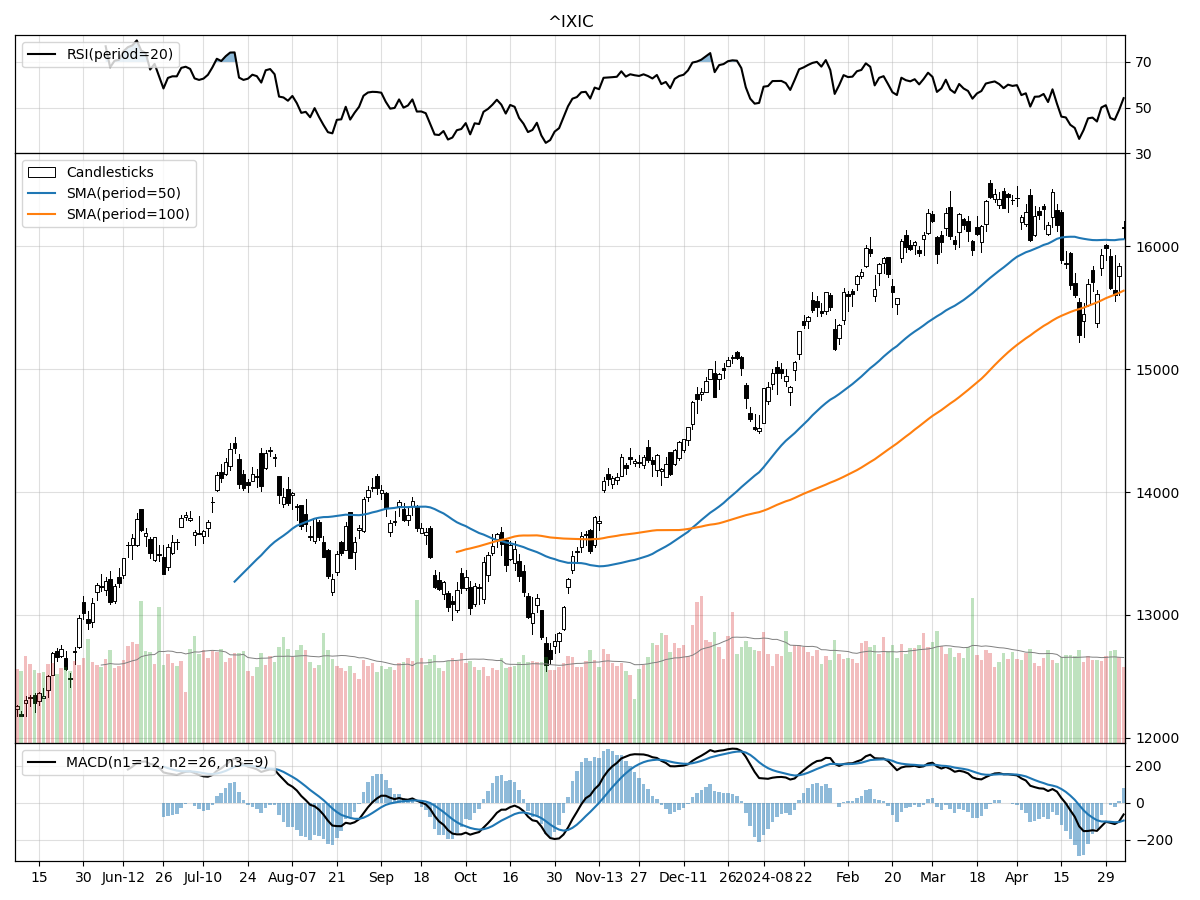
Nasdaq
Russell 2000
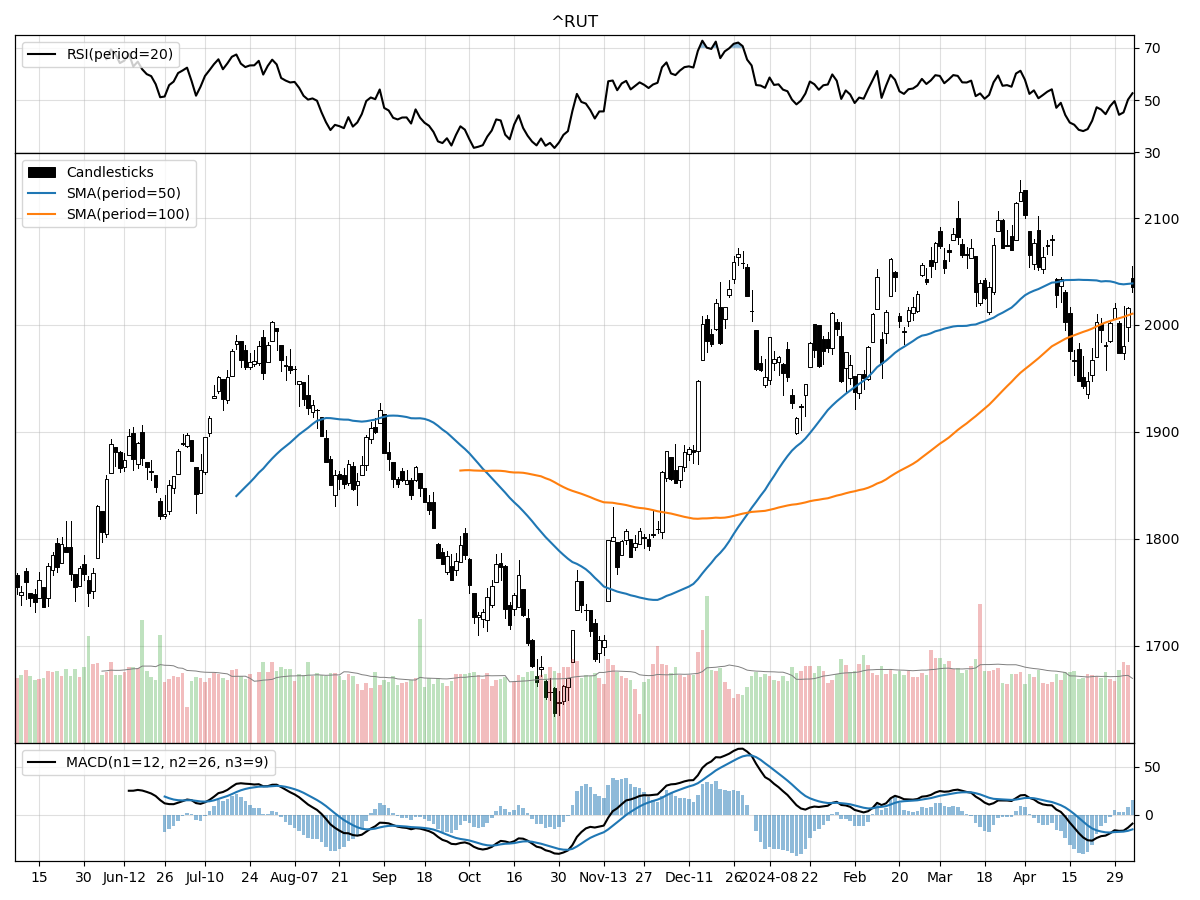
When comparing the technical performance of the S&P 500, Nasdaq, and Russell 2000 Small Cap indices, there are several key points to consider. Starting with their position relative to 52-week highs and lows, all three indices are significantly above their 52-week lows, with the Nasdaq showing the greatest relative strength, being only 1 percent below its 52-week high. The S&P 500 and Russell 2000 are 2 percent and 4 percent below their respective 52-week highs, indicating a slightly weaker relative strength for these indices. This suggests that the Nasdaq, which typically is weighted towards technology and growth stocks, has recently performed slightly better in terms of price recovery from lows and proximity to highs.
Volume is another important factor; it provides insights into investor sentiment and market liquidity. The S&P 500 and Russell 2000 are trading below their longer-term average daily volumes, which might indicate a decrease in investor participation or conviction in the current market trend. In contrast, the Nasdaq's recent daily volume is closer to its longer-term average, pointing towards a more sustained investor interest, which often aligns with technology and growth sectors' inherent volatility and investor appeal.
Finally, the technical indicators such as Money Flow and MACD (Moving Average Convergence Divergence) offer a more nuanced view of market momentum and potential shifts in investor sentiment. The Money Flow indicators suggest that all three indices are experiencing some degree of selling pressure, with the S&P 500 and Nasdaq under moderate selling pressure and the Russell 2000 under moderate buying pressure. This divergence could indicate a rotation of funds from larger-cap stocks into smaller-cap stocks, which sometimes happens when investors seek value or anticipate economic shifts that may favor smaller companies. The bearish MACD readings for all indices reflect a short-term bearish momentum. However, such readings should be contextualized within a broader market analysis, as MACD is primarily a short-term trend-following indicator and may respond quickly to recent price movements.
In summary, while the Nasdaq has shown stronger recovery towards its 52-week high, the S&P 500 and Russell 2000 are not far behind. The volume analysis suggests a more cautious approach from investors towards the S&P 500 and Russell 2000, while the Nasdaq appears to maintain steady interest. Despite some differences in buying pressure, the bearish MACD across all indices suggests that there could be short-term downward pressure or consolidation in the markets. Investors should monitor these indicators in conjunction with fundamental analysis to make informed decisions.
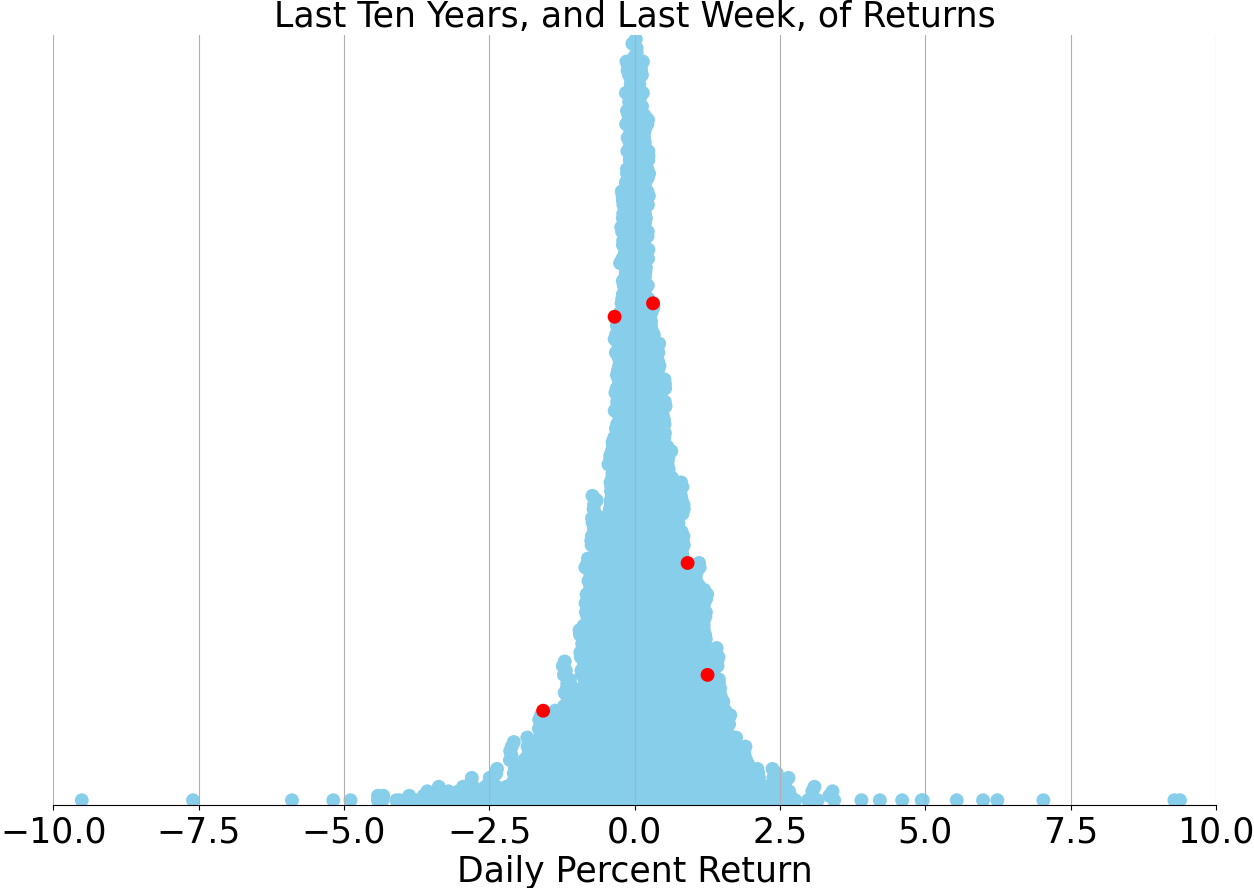
Last week vs. history (Large Cap S&P 500)
Market Commentary
Markets Navigate a New Economic Landscape Amid Policy and Earnings Developments
As the financial markets transition from a period of robust gains, which began last November, to a more tumultuous phase, investors are closely monitoring the interplay of Federal Reserve policy, labor market dynamics, and corporate earnings. The convergence of these factors has become increasingly evident, particularly in the past week, which saw stocks rebounding after April's downturn—the first monthly decline since October. However, the recent volatility signals an adjustment to fresh economic data and a reassessment of market expectations.
Fed Policy: A Shifting Timeline for Rate Adjustments
The Federal Reserve's monetary policy has been a cornerstone of market sentiment, with investors initially anticipating rate cuts. However, persistent inflation has altered this outlook, pushing the timeline for any potential rate reductions further into the future. A key inflation indicator, the U.S. core Consumer Price Index (CPI), continues to show elevated year-over-year changes, signaling that inflationary pressures are more stubborn than previously thought. Housing costs, a significant component of the CPI, will need to show more significant moderation to contribute to a meaningful decrease in overall inflation rates.
Labor Market: Seeking a Balanced Scenario
The labor market remains robust, with April's job gains, although slower than previous months, still indicative of a healthy employment environment. This consistent job growth is illustrated by the trends in U.S. nonfarm payrolls, which, despite the recent deceleration, maintain a positive trajectory when compared to historical data. Moreover, wage growth has started to temper, a development that could alleviate some inflationary concerns. This moderation in wage inflation is crucial for the Fed as it assesses the balance between employment strength and price stability.
Earnings: A Subtle Pillar of Support
Corporate earnings have quietly provided a foundation for market confidence. As expectations for a Fed rate cut dissipated, investors turned their focus to earnings growth as a potential driver for market performance. The S&P 500 Index's year-to-date performance may have experienced some setbacks, but the twelve-month consensus estimates for S&P 500 earnings per share (EPS) suggest that earnings growth could remain a key determinant of market direction in the coming year.
Valuations and Market Breadth: Signs of Resilience
Despite the rise in market valuations, they do not appear overstretched, particularly if earnings growth sustains its momentum. The next-twelve-months price-to-earnings (P/E) ratio for the S&P 500 has been trending upwards, yet it remains within a range that many analysts consider reasonable under the current earnings outlook. Additionally, market leadership has expanded beyond the technology sector, with cyclicals and defensive stocks contributing to a more diversified performance landscape.
Looking Ahead: Economic Indicators and Market Strategy
Investors will be keeping a close eye on upcoming economic indicators, such as the Michigan Consumer Sentiment Survey and outstanding consumer credit data, for further guidance on the market's direction. In light of the evolving economic environment, investment strategies may need to be recalibrated. Diversification and a keen understanding of the interplay between economic indicators and market performance will be crucial for navigating the markets.
Expert Insight: Craig Fehr's Analysis
Craig Fehr, CFA, and investment strategist at Edward Jones, emphasizes the importance of analyzing economic trends and market conditions to construct effective investment strategies. With a wealth of experience and a strong academic background, Fehr provides valuable insights into the current state of the financial markets and offers asset allocation guidance to help investors achieve their financial goals.
Navigating Uncertainty: A Final Word
The financial landscape is inherently dynamic, with factors such as Fed policy shifts, labor market changes, and earnings outcomes influencing market movements. While past performance is not indicative of future results, understanding these variables and their potential impact on investments is essential for making informed decisions. As always, investors should be mindful of the risks associated with different asset classes and consider their unique investment objectives and financial situations when making investment choices.
AI stock picks for the week (Large Cap S&P 500)


