
The Monday Charge: May 13, 2024
As the financial markets grapple with a persistent high-interest rate environment, a scenario unfamiliar to many of the newer market participants, the Federal Reserve's policies and inflation figures remain at the forefront...

This is our Monday article, focusing on the large cap S&P 500 index. Just the information you need to start your investing week. As always, 100% generated by AI and Data Science, informed, objective, unbiased, and data-driven.
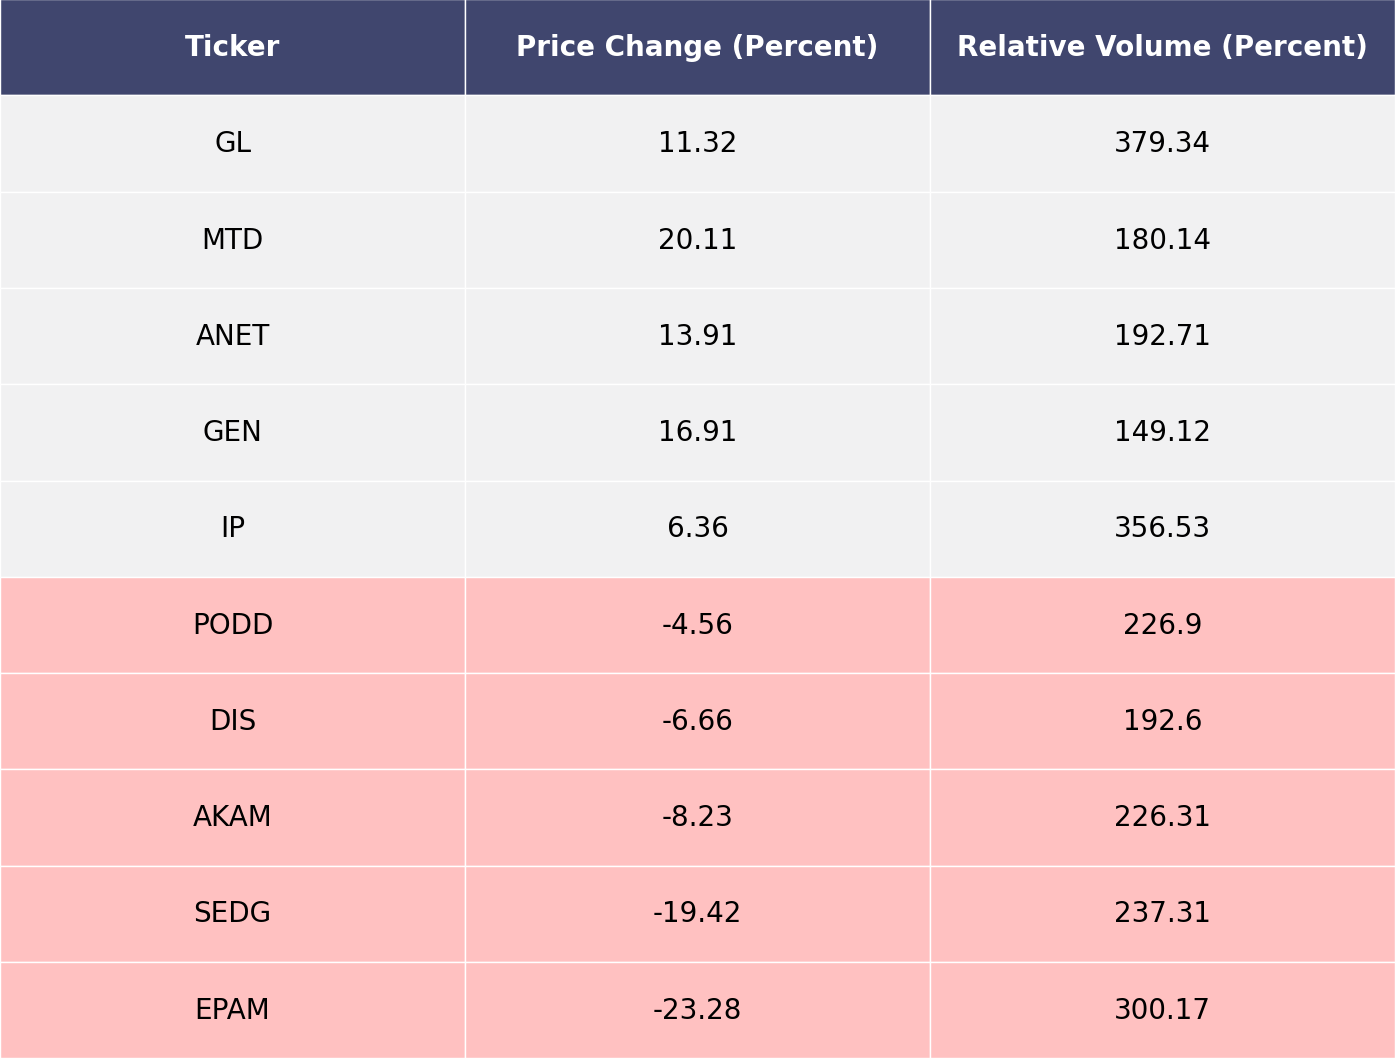
The biggest movers last week on price and volume (Large Cap S&P 500)
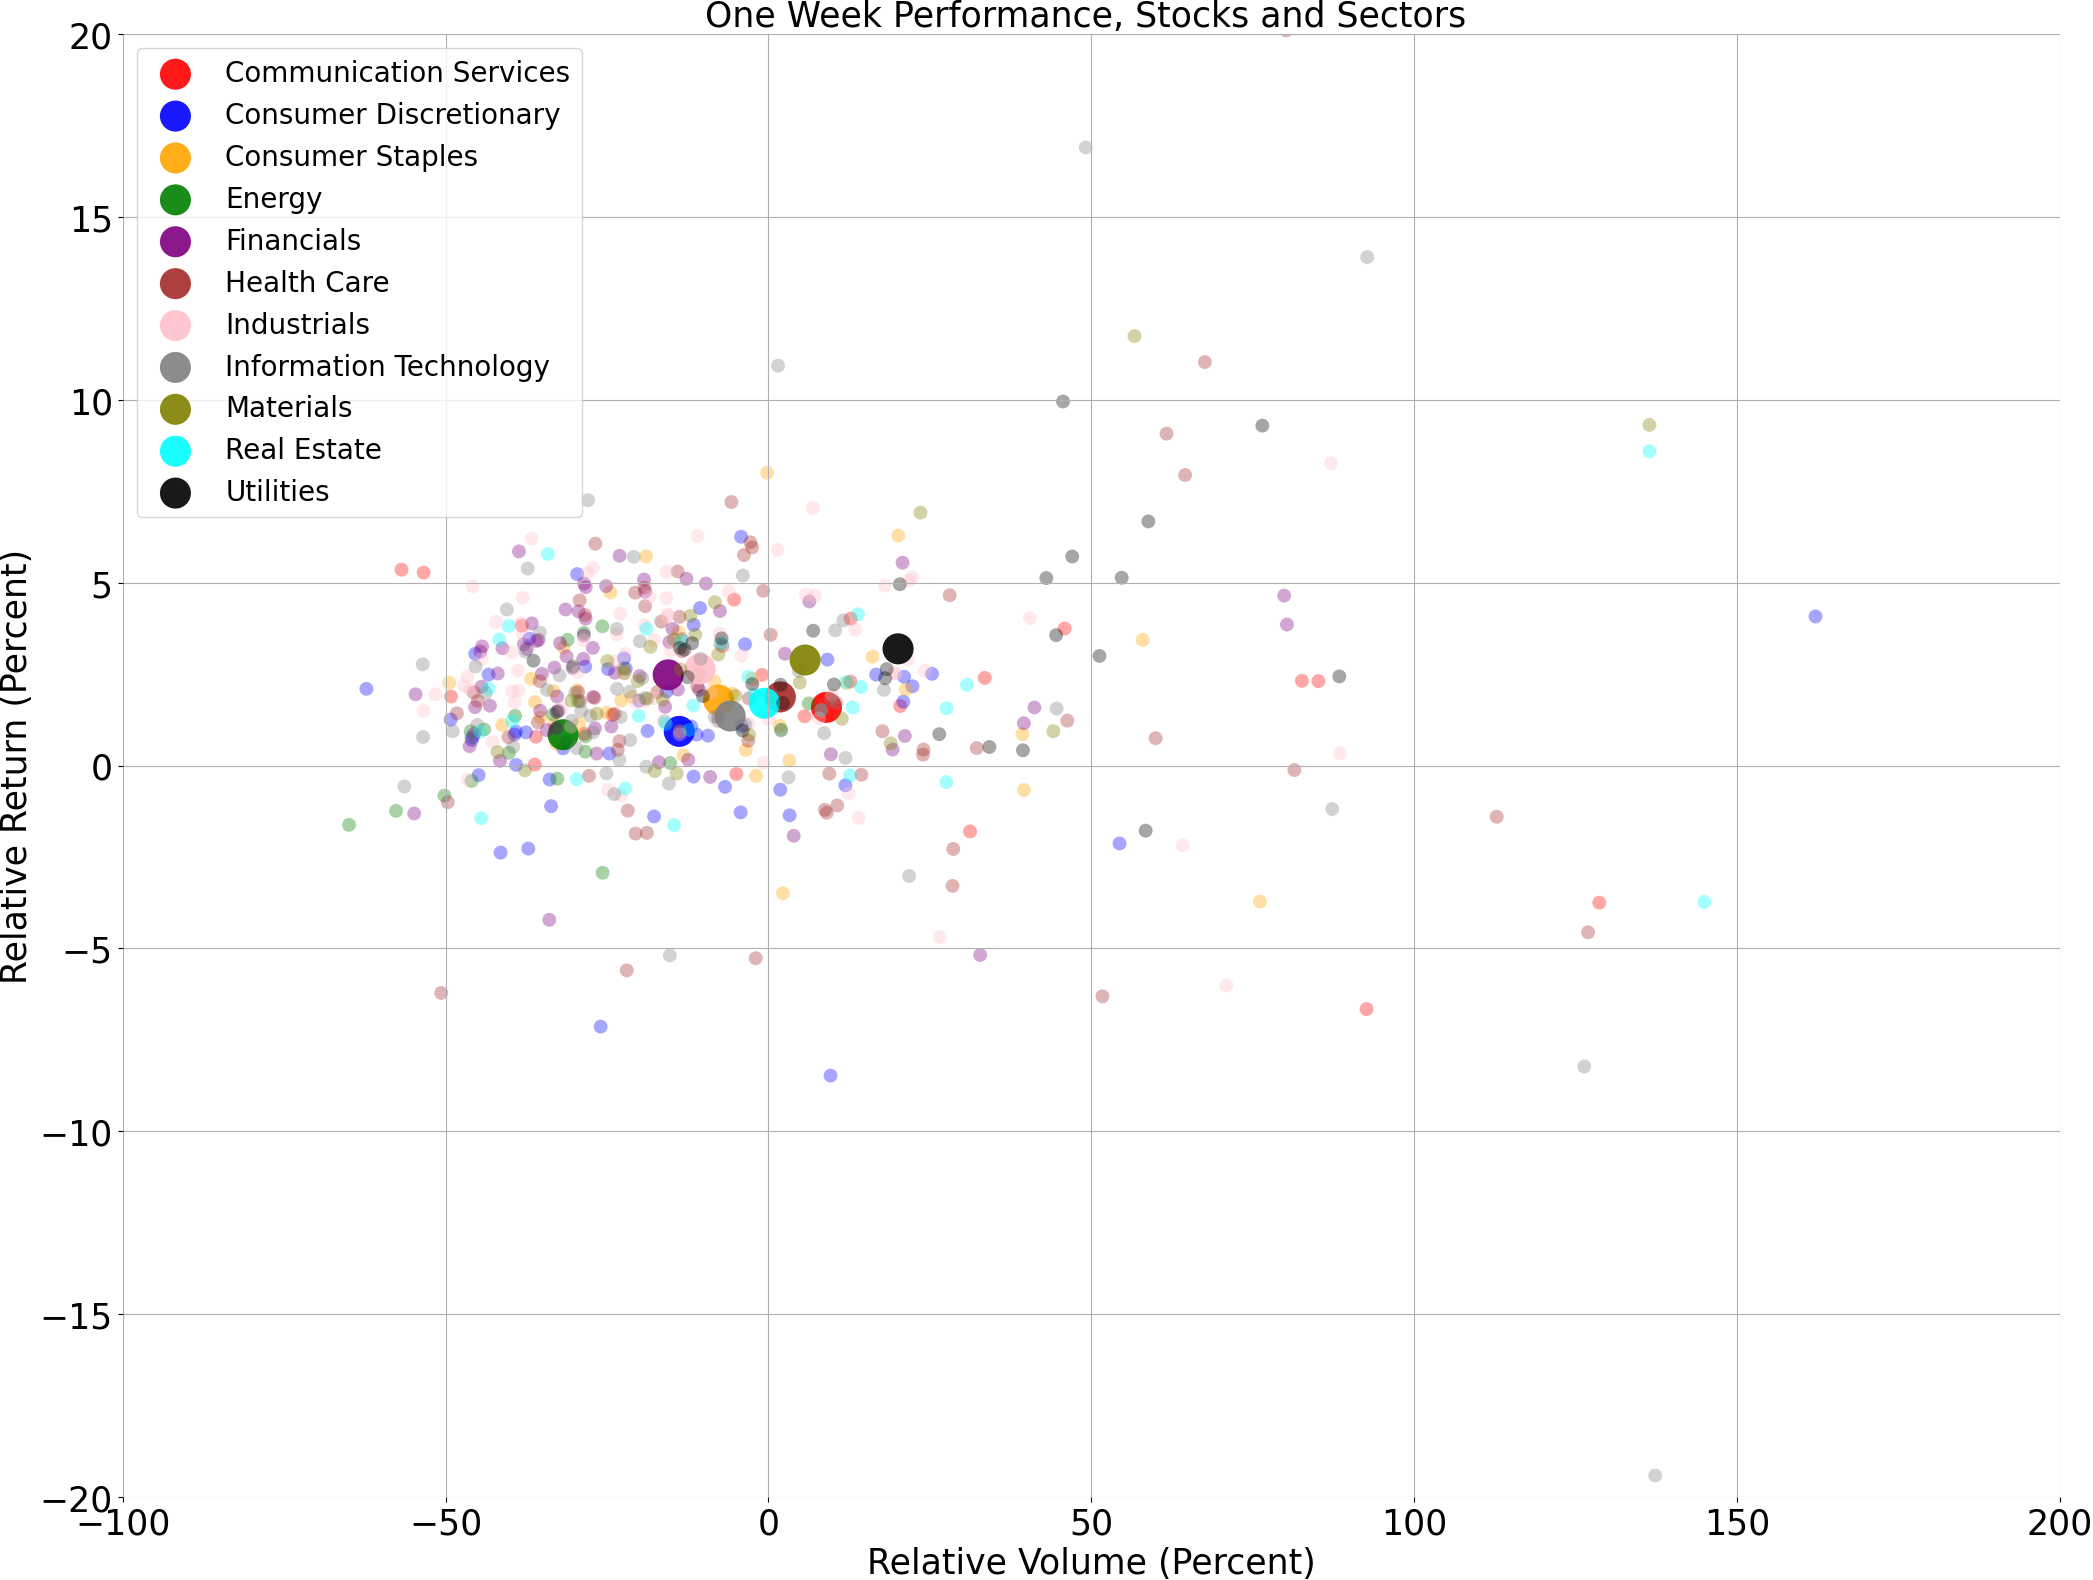
Price and volume moves last week for every stock and sector (Large Cap S&P 500)
A technical analysis across indices
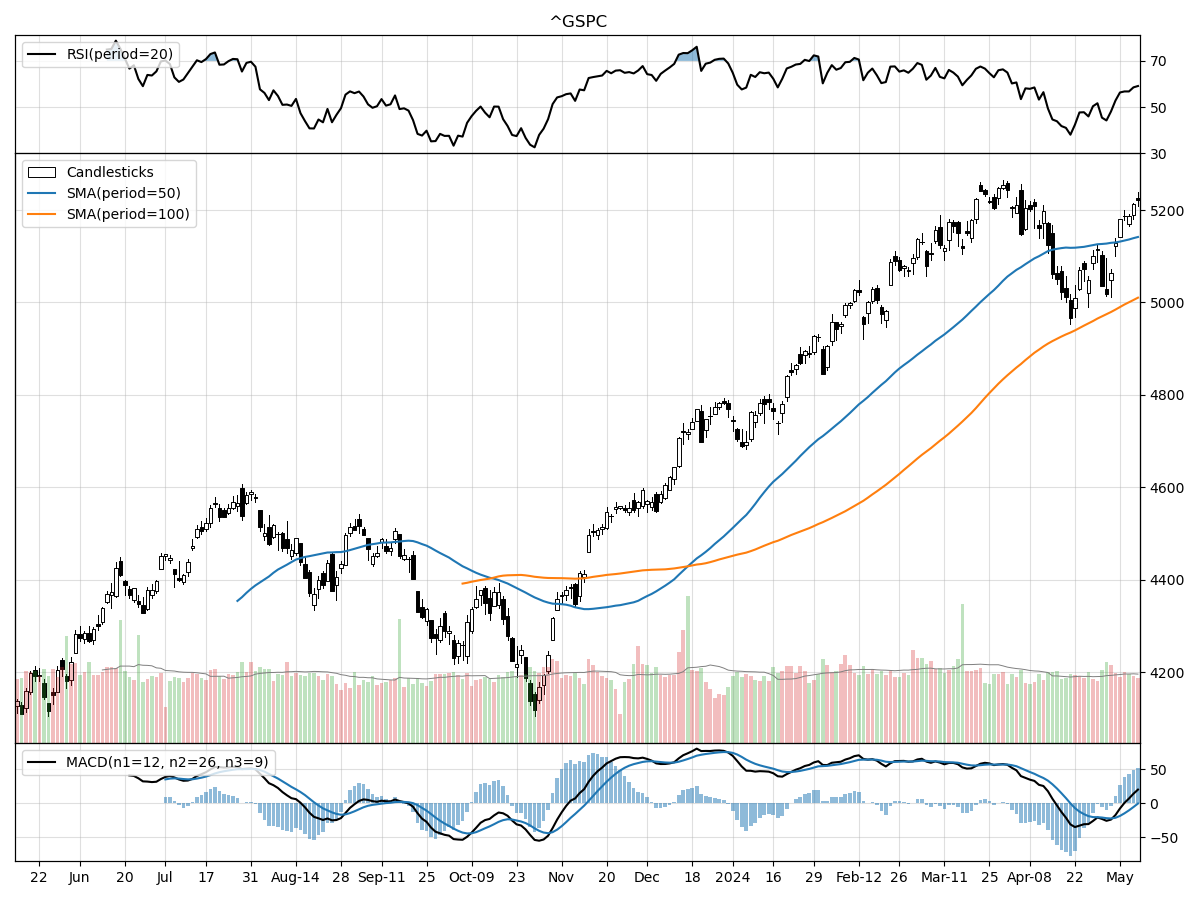
S&P500
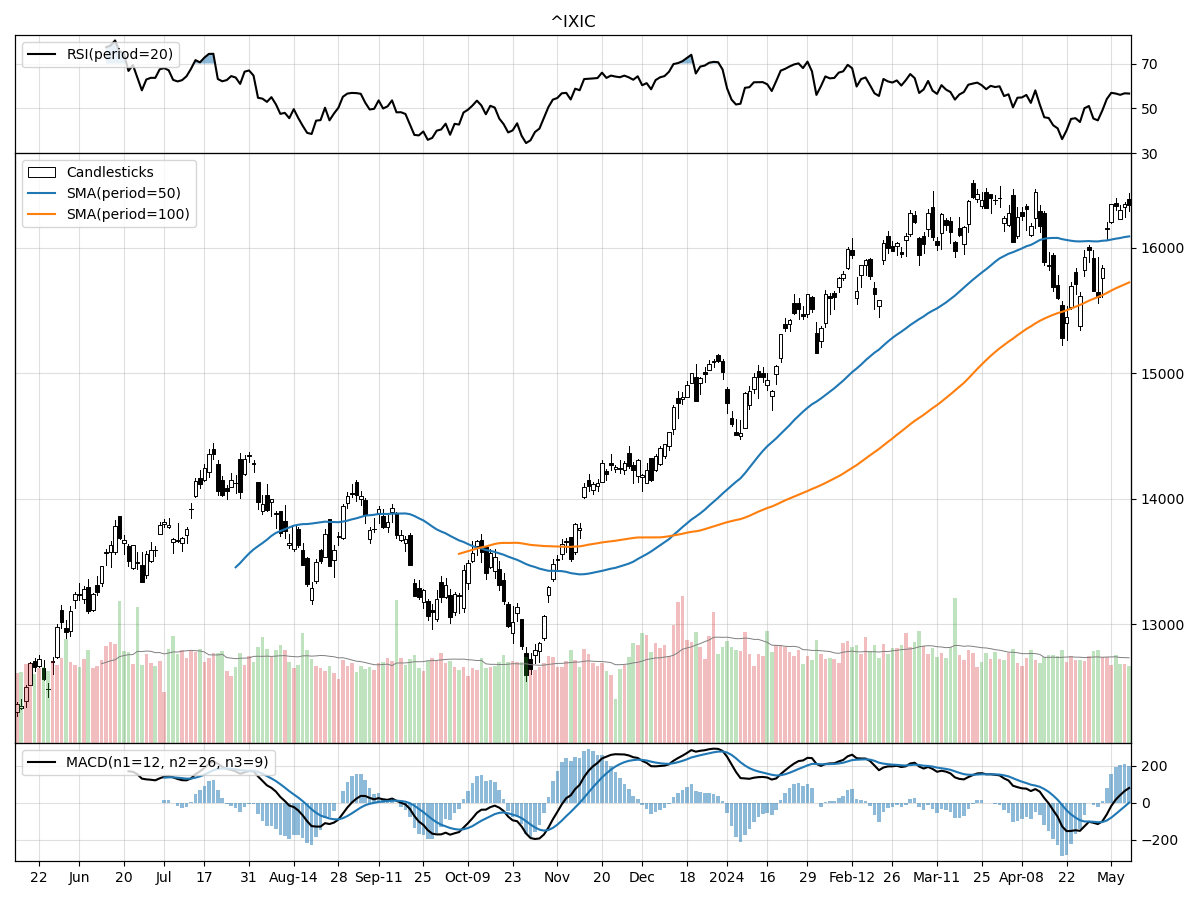
Nasdaq
Russell 2000
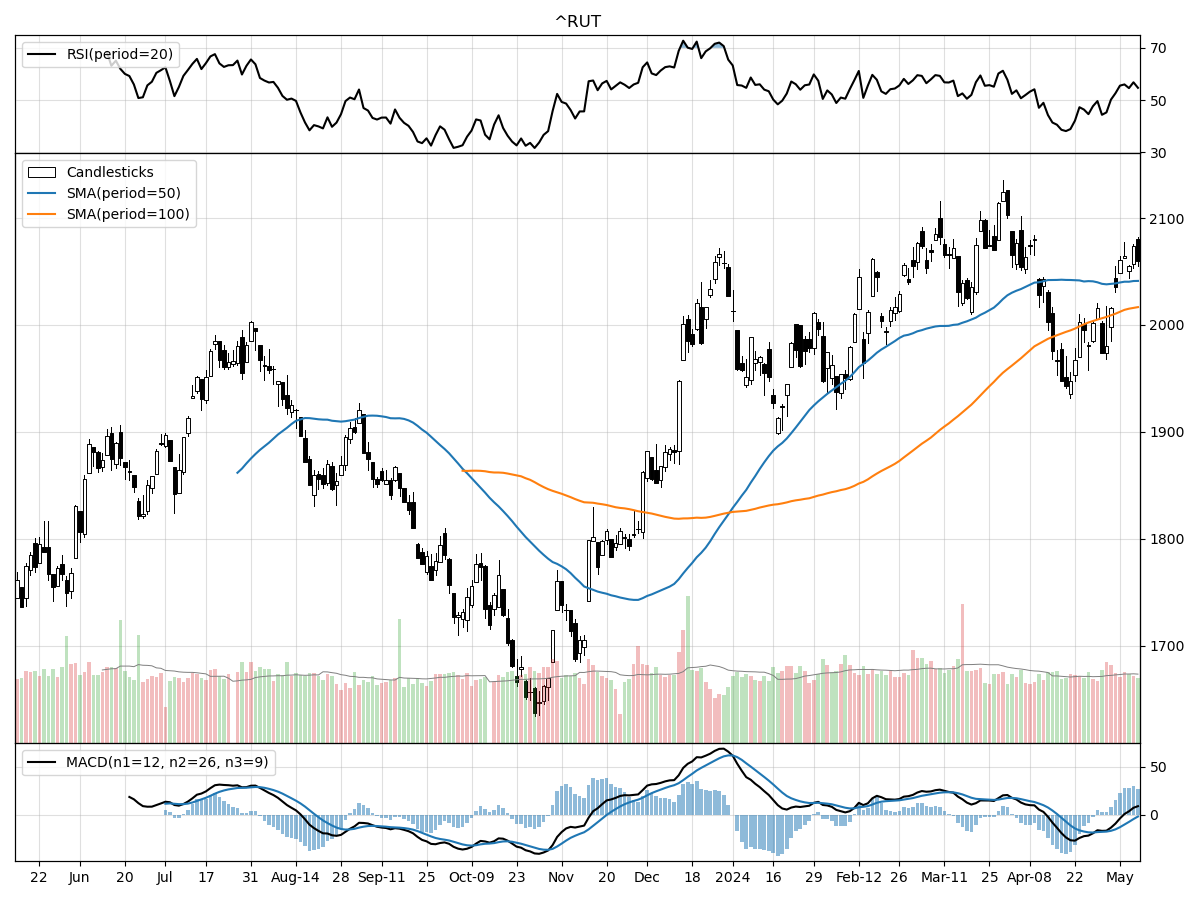
As a stock analyst reviewing the current technical performances of the S&P 500, Nasdaq, and Russell 2000 Small Cap indices, it is evident that there are similarities and differences across these major market indicators.
The S&P 500 and Nasdaq indices are showing some congruence in their technicals, with both currently trading at or near their 52-week highs, indicating a strong bullish trend in the large-cap and tech-heavy sectors of the market. However, the S&P 500 is showing a bearish Moving Average Convergence Divergence (MACD) at -0.39, suggesting potential downward momentum or consolidation in the near term. In contrast, the Nasdaq exhibits a bullish MACD at 0.524, indicating continued upward momentum. This divergence in MACD readings could imply sector-specific dynamics, where the broader market represented by the S&P 500 is facing headwinds, while the tech-centric Nasdaq continues to push higher. Both indices are experiencing moderate buying pressure according to Money Flow indicators, but the S&P 500 is seen as modestly overbought on the Relative Strength Index (RSI), which could signal a possible pullback.
The Russell 2000 Small Cap index, on the other hand, presents a mix of signals that differ from the S&P 500 and Nasdaq. While it has also remained relatively stable over the past few months, it is not at its 52-week high, sitting 3 percent below it. This indicates that small-cap stocks have not kept pace with the large-cap and tech sectors, potentially offering more room for growth or signaling caution about the economic outlook for smaller companies. The Russell 2000's MACD is more bearish at -1.99, which could be a cause for concern, suggesting a stronger bearish sentiment in the small-cap space. However, like the other indices, it is under moderate buying pressure and is not considered overbought or oversold according to the RSI, thus providing a more neutral stance.
In summary, the S&P 500 and Nasdaq are showing signs of strong bullish trends but diverge on momentum indicators, with the S&P 500 potentially facing a near-term correction and the Nasdaq continuing to climb. The Russell 2000 is not as strong, with more bearish momentum and less proximity to its 52-week high, which could either suggest a lag in performance or an opportunity for growth, depending on broader market conditions and investor sentiment towards small-cap stocks. As an investor, one would need to consider these technicals in the context of the broader economic environment, sector-specific trends, and individual risk tolerance when making investment decisions.
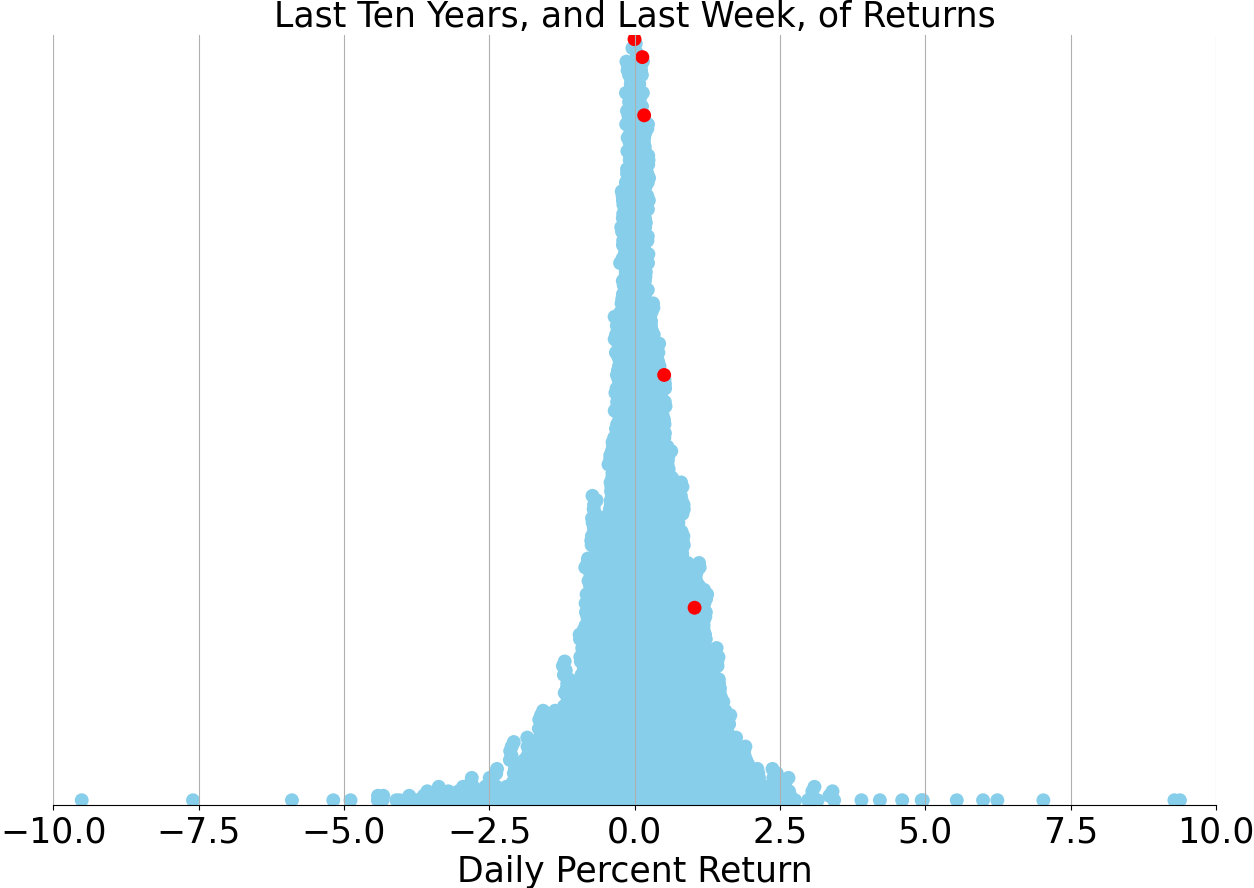
Last week vs. history (Large Cap S&P 500)
Market Commentary
Navigating a High-Interest Rate Landscape: The Unseen Hand of Corporate Earnings
As the financial markets grapple with a persistent high-interest rate environment, a scenario unfamiliar to many of the newer market participants, the Federal Reserve's policies and inflation figures remain at the forefront of investor concerns. However, one critical aspect that often gets overshadowed in the constant evaluation of Fed implications is the power of corporate profits. As we conclude the first-quarter earnings season, a deeper look into the state of corporate America seems indispensable for understanding the stock market's direction.
Earnings Growth: A Beacon for Bull Markets?
The latest data suggests that the S&P 500 earnings growth might see an upswing in 2024, a sign that could underpin the longevity of the current bull market. While historical trends have shown a tendency for earnings revisions to skew downwards, the current stability, despite the overhang of rate hikes and economic uncertainties, is noteworthy. This resilience in earnings forecasts could signal underlying strength in corporate performance, which is a vital driver of stock prices over the long haul.
The S&P 500 and Forward Earnings: A Parallel Journey
The trajectory of the S&P 500 has historically mirrored the path of forward earnings for the index, with both metrics currently near record highs. This correlation underscores the importance of earnings as a fundamental factor in stock valuations. The steadfastness of forward earnings, even in the face of macroeconomic headwinds, could be a harbinger of market confidence.
Economic Data: A Soft Landing Over a Hard Fall?
The current economic landscape presents a scenario where moderate data releases might be more favorable than stellar ones. The economic surprise index, when plotted against the 10-year Treasury yield, shows a trend where softer data is contributing to a pullback in yields. This dynamic could suggest that a gentler economic deceleration may be underway, which could potentially ease the pressure on the Fed to maintain an aggressive rate hike stance.
The Inflation Trajectory: Signs of Easing?
Inflation has been a thorn in the side of the economy, but recent trends in key sectors suggest a possible easing. Used car prices, which surged during the pandemic, have been on a decline since their peak in 2021. Similarly, the inflation rate for newly-signed rents has shown a significant drop. These indicators could point to a broader cooling in inflationary pressures, which would have profound implications for monetary policy and market sentiment.
Strategic Portfolio Positioning Amidst Rate Uncertainty
Investors are advised to position their portfolios to accommodate various scenarios but with a lean towards the prospect of lower rates. While the bond market, represented by vehicles like the iShares Core U.S. Aggregate Bond ETF, offers insights into future expectations, it's crucial to remember that past performance is not indicative of future results. Investors must weigh the risks involved, including interest rate, credit, and market risks, and understand that investment values can fluctuate, leading to potential losses of principal.
Upcoming Economic Indicators and Market Insights
Key economic releases, such as the CPI inflation data and retail sales figures, are on the horizon this week, providing fresh fodder for market analysis. As we disseminate the weekly market updates, it's important to emphasize that such information is for educational purposes and not specific investment advice. Investors should tailor their decisions to their unique objectives and financial situations, and remember that diversification does not ensure a profit or protect against a market downturn.
In conclusion, while the market's focus remains fixated on the Fed's next move and inflation's trajectory, the silent yet potent narrative of corporate earnings growth should not be overlooked. It's a critical component that offers a more nuanced and comprehensive view of the market's potential direction. As always, a prudent investment strategy should consider a broad spectrum of factors, including economic data, corporate health, and geopolitical events, to navigate the ever-evolving financial landscape.
AI stock picks for the week (Large Cap S&P 500)


