
The Monday Charge: May 20, 2024
In the world of finance, peaks are inevitable, but the side of the peak you find yourself on can make all the difference. As investors celebrate the ascent of equities...

This is our Monday article, focusing on the large cap S&P 500 index. Just the information you need to start your investing week. As always, 100% generated by AI and Data Science, informed, objective, unbiased, and data-driven.
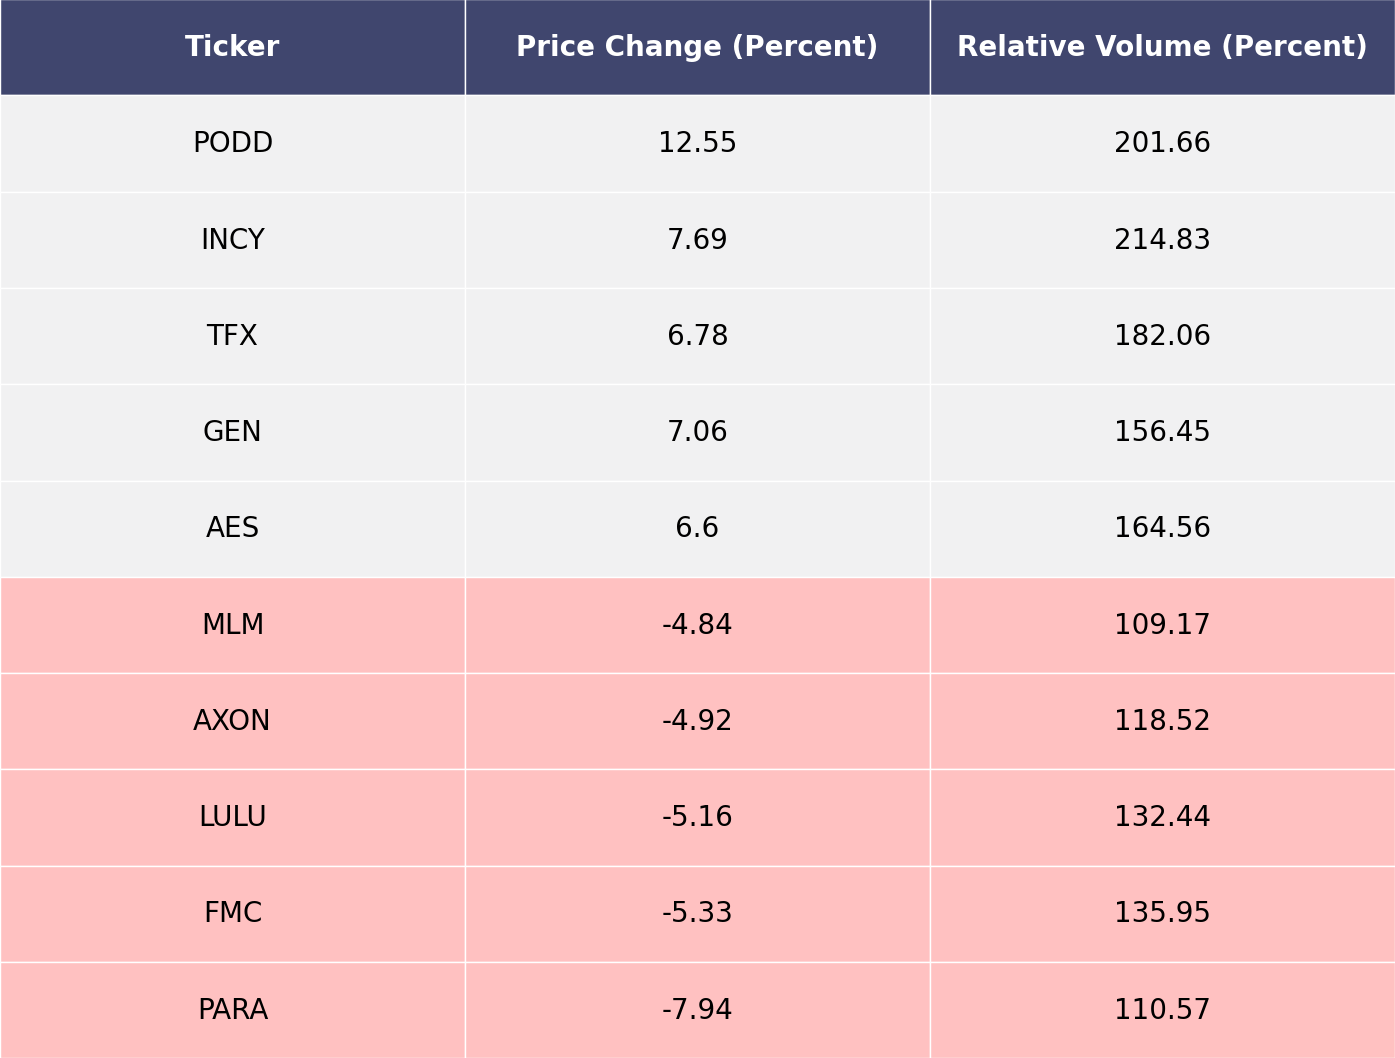
The biggest movers last week on price and volume (Large Cap S&P 500)
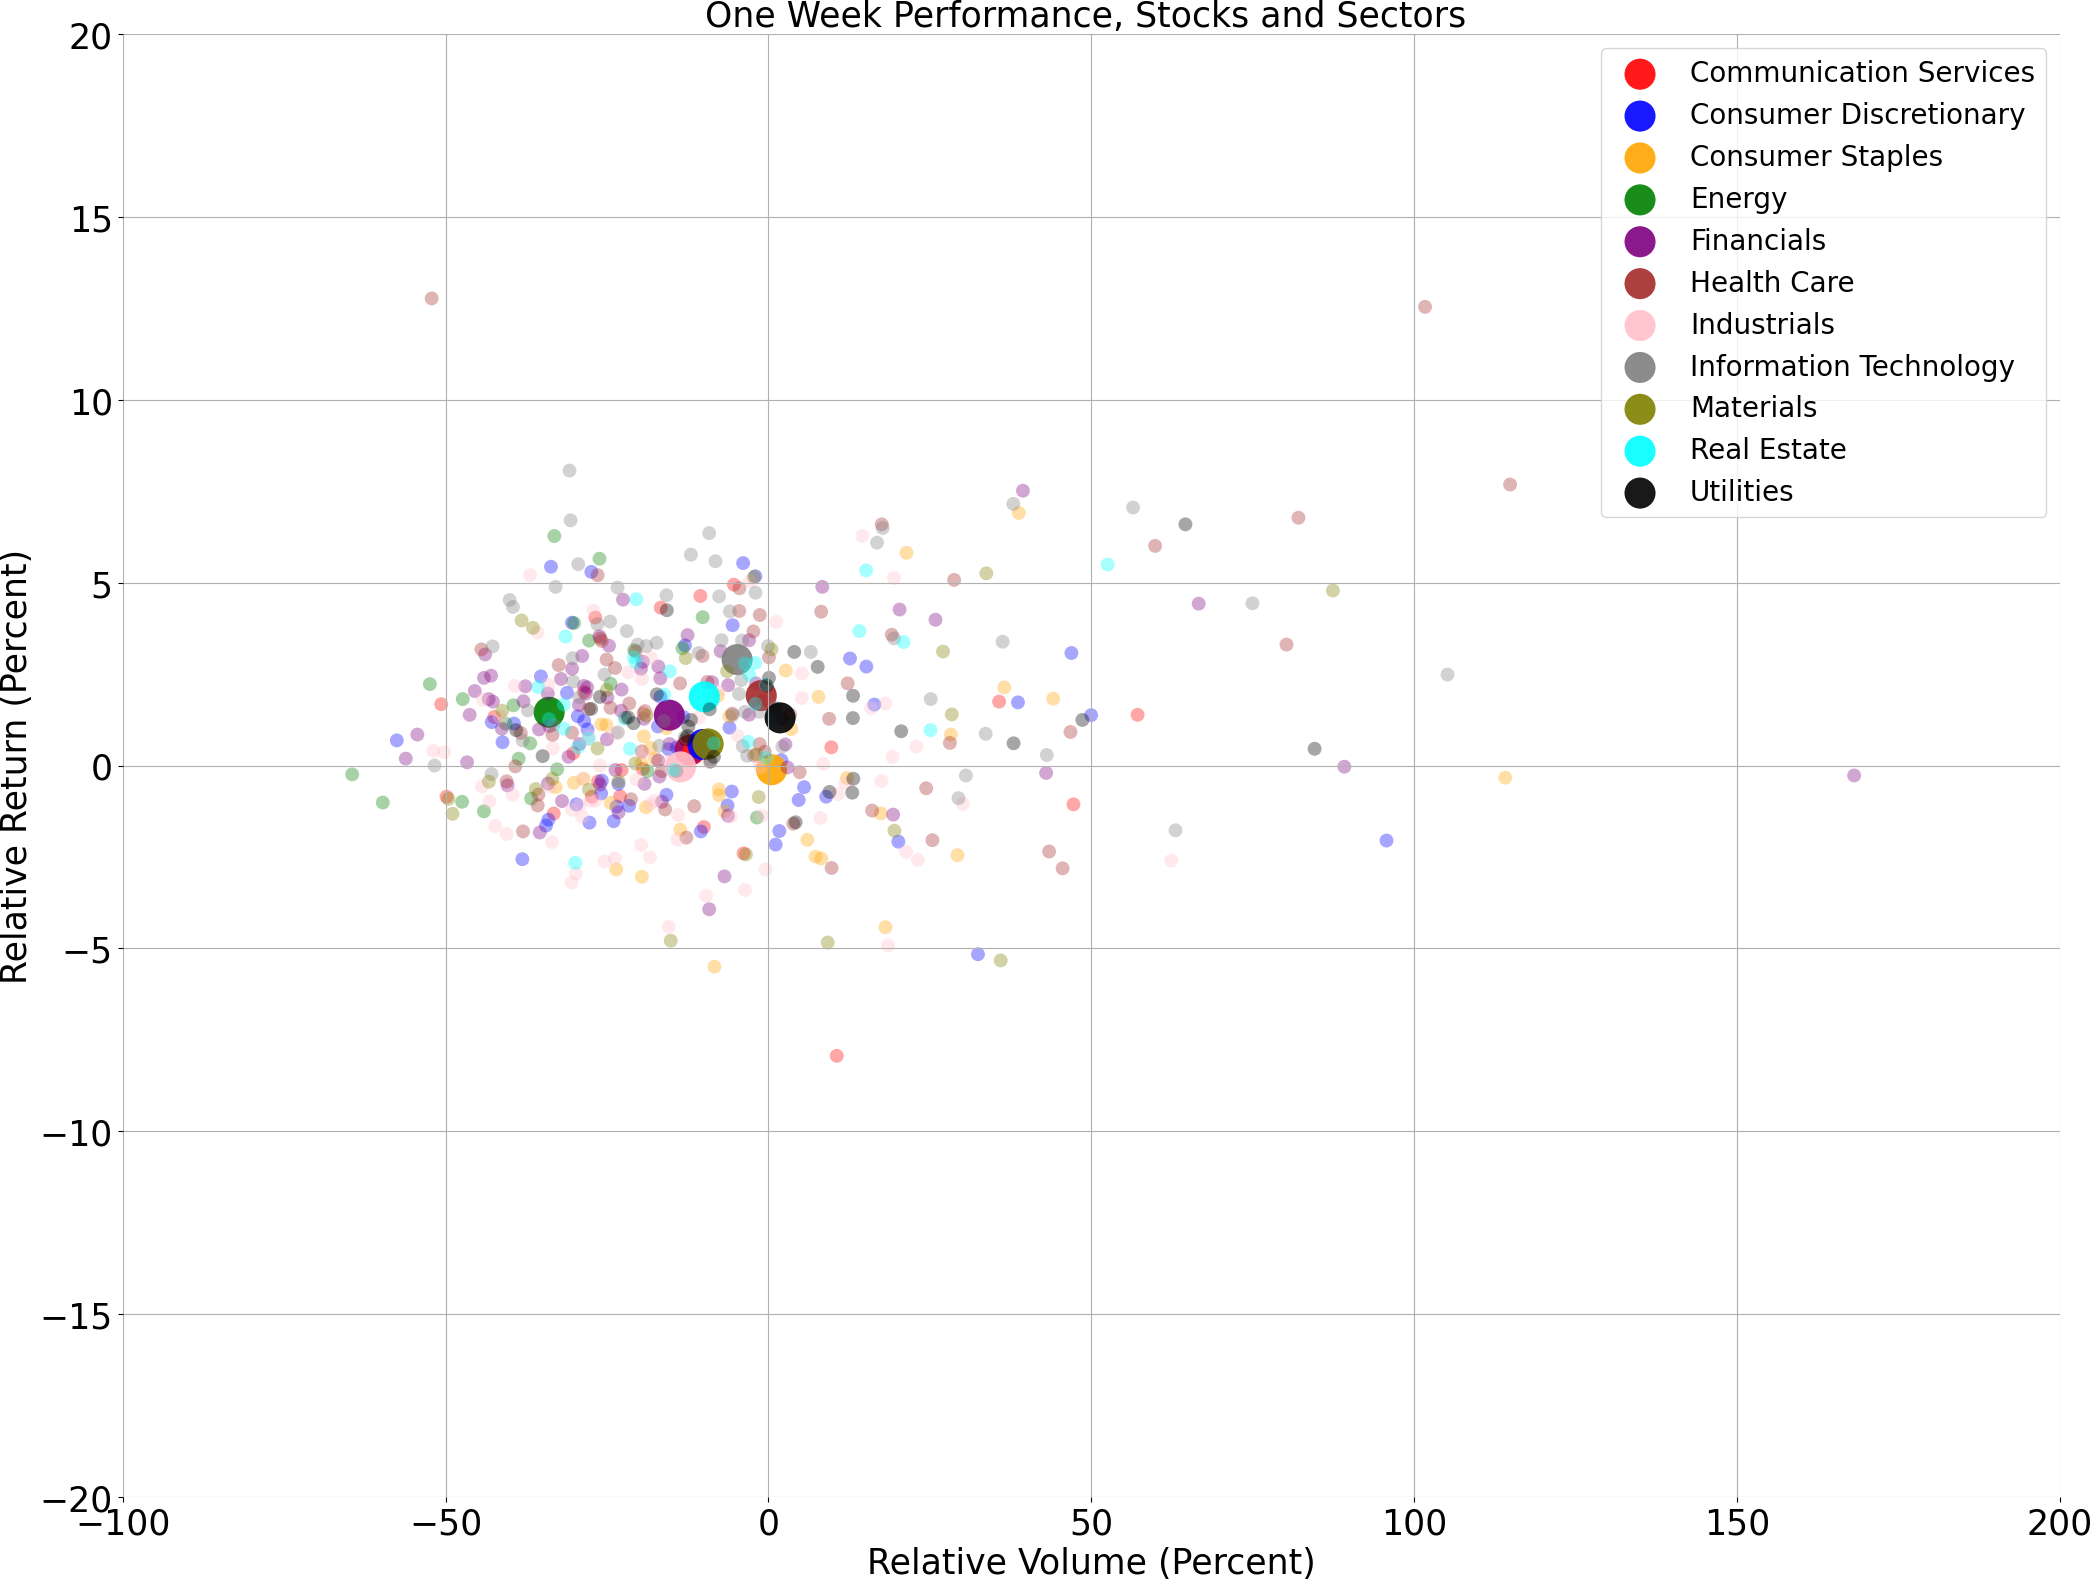
Price and volume moves last week for every stock and sector (Large Cap S&P 500)
A technical analysis across indices
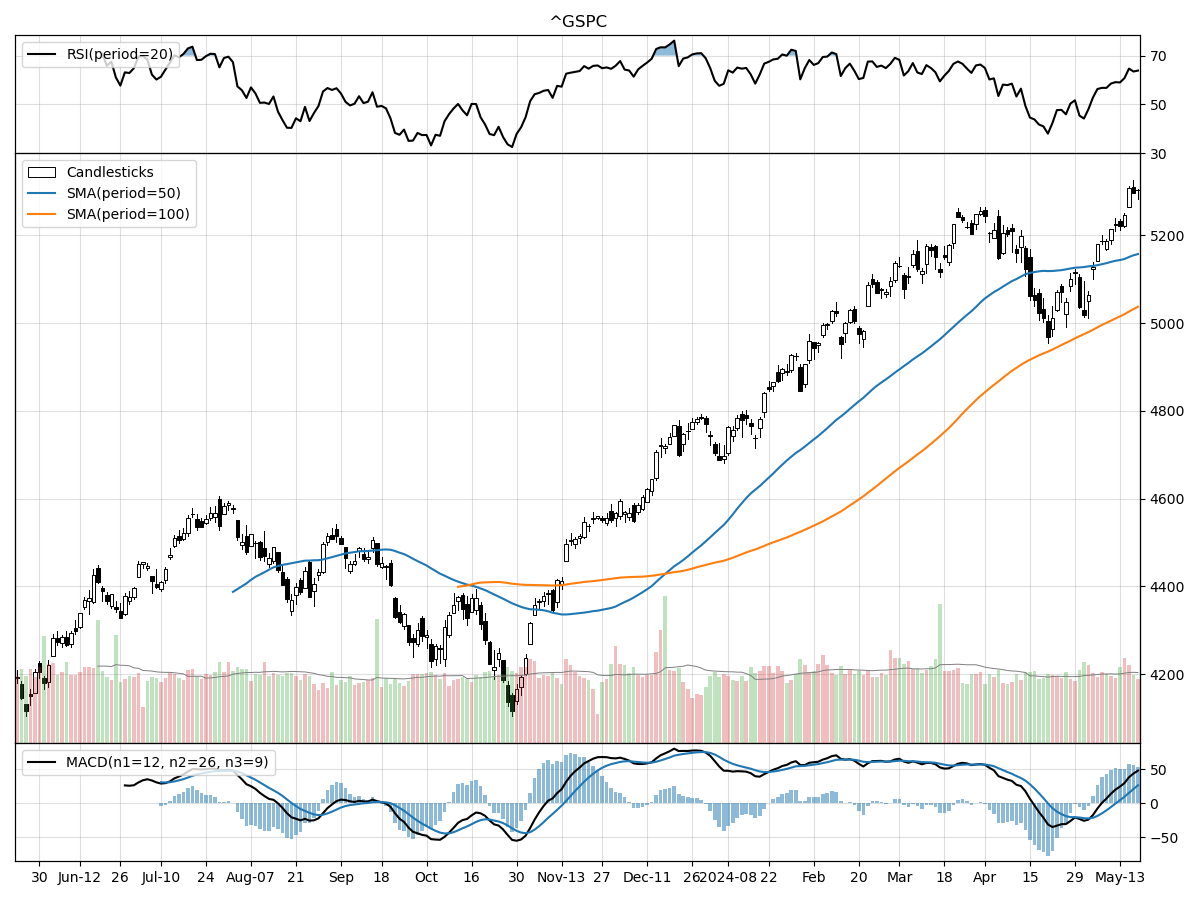
S&P500
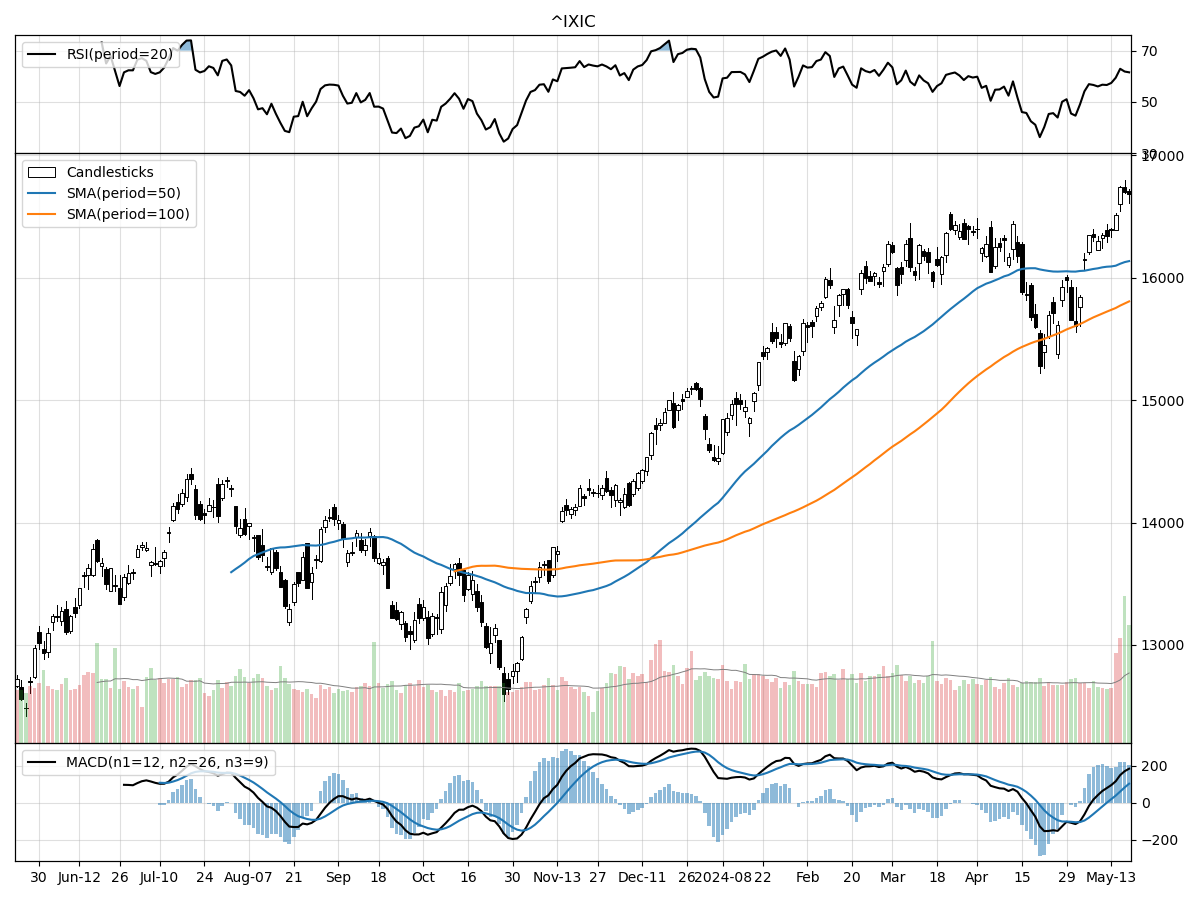
Nasdaq
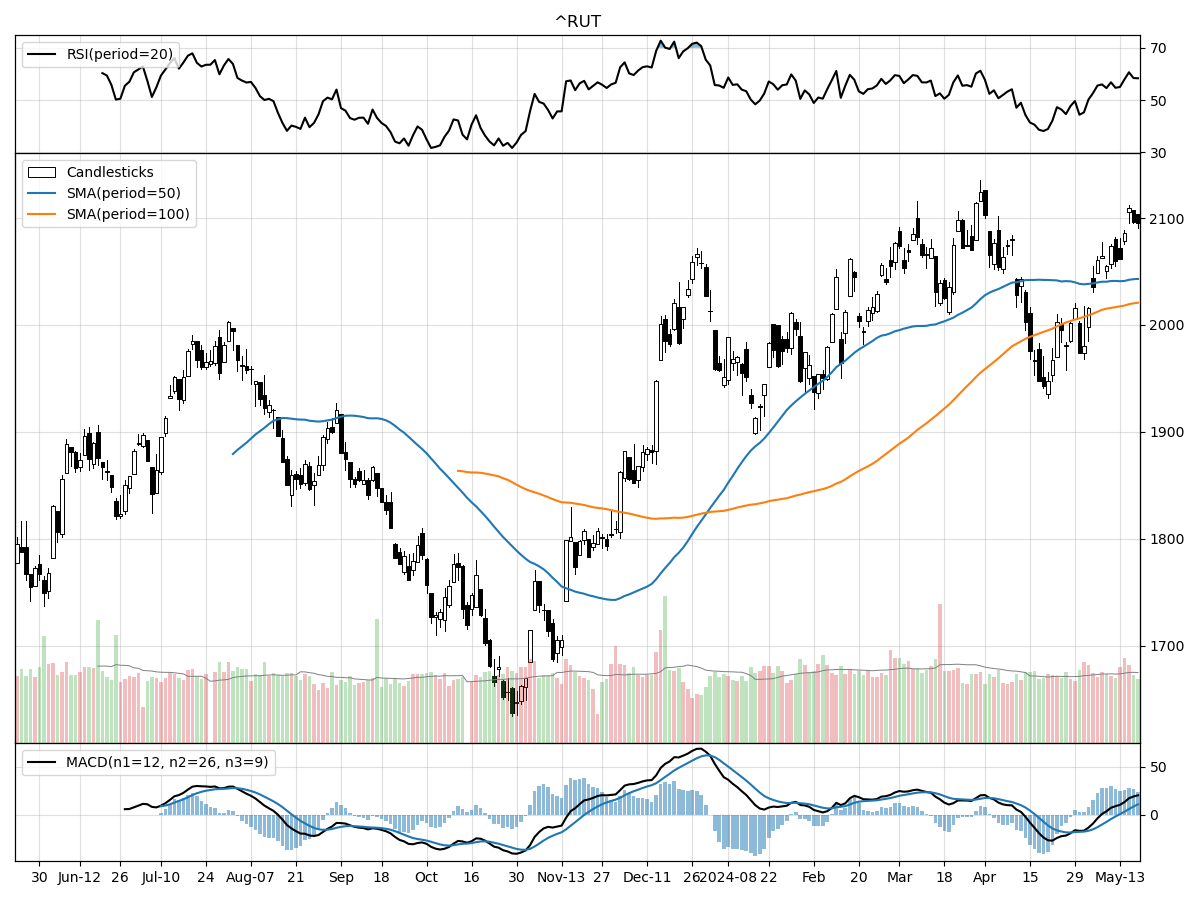
Russell 2000
The S&P 500, Nasdaq, and Russell 2000 indices have all shown robust performance over the past month, but each exhibits unique technical characteristics that investors should consider. The S&P 500 has seen a 5.84% rise in the last month and is currently trading 28% above its 52-week low, although it remains at its 52-week high. The index is under moderate buying pressure, as indicated by money flow indicators, and is experiencing bullish momentum with a MACD of 26.51. However, the RSI points to it being modestly overbought, suggesting that investors should be cautious of potential short-term corrections.
The Nasdaq index has outperformed the other indices with a notable 7.99% increase over the past month. Currently trading 33% above its 52-week low and at its 52-week high, the Nasdaq is also under moderate buying pressure. Its RSI also indicates it is modestly overbought, and the bullish sentiment is reinforced by a strong MACD of 103.6. The heightened volume compared to its long-term average suggests increased investor interest, potentially driven by the tech sector's resilience and growth prospects.
In comparison, the Russell 2000 has risen by 6.52% over the last month and is trading 28% above its 52-week low, just 1% shy of its 52-week high. Similar to the other indices, it is under moderate buying pressure and is accumulating, but it is also modestly overbought according to the RSI. The MACD at 10.74 indicates bullish momentum. The Russell 2000’s performance is indicative of renewed investor confidence in small-cap stocks, which often benefit from economic recoveries and growth spurts.
In summary, while all three indices are showing bullish technical indicators and moderate buying pressure, the Nasdaq stands out with the highest recent monthly gain and volume activity. However, all three indices are modestly overbought, signaling that investors should remain cautious of potential pullbacks. Each index offers unique opportunities: the S&P 500 for its broad market representation, the Nasdaq for its tech-heavy growth potential, and the Russell 2000 for small-cap exposure.
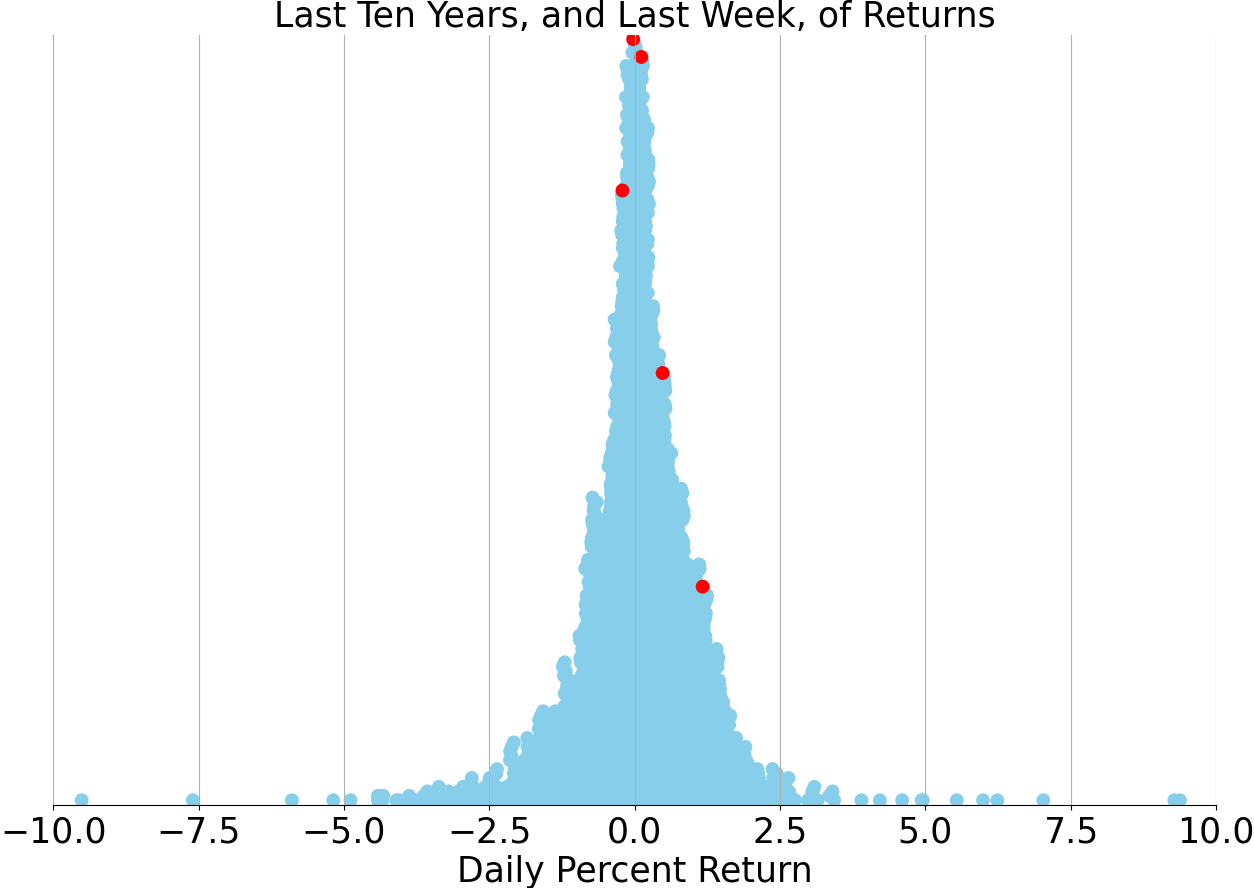
Last week vs. history (Large Cap S&P 500)
Market Commentary
Market Peaks and Valleys: Navigating the Current Economic Landscape
In the world of finance, peaks are inevitable, but the side of the peak you find yourself on can make all the difference. As investors celebrate the ascent of equities, others are breathing a sigh of relief as inflation shows signs of descent. The recent market movements have been notably influenced by the interplay between inflation and the stock market. With inflation seemingly past its peak, the stock market has been buoyed, reaching new heights. The Dow Jones Industrial Average recently touched the 40,000 mark, driven by a better-than-expected inflation report, raising hopes that the favorable trends will continue.
The inflation report, which was eagerly anticipated by market participants, provided the necessary boost to investor sentiment. Although inflation remains higher than desired, it has significantly cooled from its peak in early to mid-2022. Core inflation, in particular, has shown signs of easing, thanks to a reduction in services prices. However, the path to further declines in inflation may require additional relief from shelter prices, which have been stubbornly high. The market is closely watching these metrics, as they will play a crucial role in determining future economic conditions.
The stock market's recent ascent can be attributed to more balanced leadership across various sectors. The S&P 500 has gained 11% from its previous peak at the end of 2021, despite experiencing a rollercoaster of declines and recoveries throughout 2022 and 2023. Notably, sectors such as Utilities and Technology have outperformed, while Industrials and Financials have lagged. This diversified performance suggests a healthier market environment, where gains are not reliant on a single sector's success.
Historically, stocks have tended to extend gains after surpassing prior peaks, and current trends appear to support this pattern. Data comparing all-time highs in the stock market with subsequent 12-month returns generally indicate positive outcomes. This optimism is further bolstered by rising corporate earnings, which have recently reached new highs. As companies continue to report strong profits, the foundation for sustained market gains seems solid.
Beyond equities, other financial instruments are also showing notable trends. Long-term interest rates, represented by the 10-year Treasury yield, appear to have peaked for this cycle. Initially driven by inflation fears, these yields reached a higher peak in late 2023 amid concerns of rising Federal Reserve interest rates. However, recent trends suggest that these rates may have stabilized, providing a more predictable environment for investors.
Commodities, too, have displayed divergent performances. Gold prices have reached new highs, reflecting investor demand for safe-haven assets amid economic uncertainties. Conversely, oil prices have retreated from their earlier peaks in early 2022, influenced by various factors including geopolitical tensions and fluctuating demand. This divergence underscores the complex dynamics at play in the commodities market.
The resurgence of meme stocks like GameStop and AMC has added another layer of intrigue to the market. These stocks, which peaked in 2021 due to retail investor frenzy, have once again captured headlines. Their volatility serves as a reminder of the speculative elements that can influence market behavior, even as more traditional metrics point to a generally positive outlook.
Looking ahead, important economic releases this week, including data on home sales and the S&P Global Manufacturing PMI, will provide further insights into the health of the economy. Investors will be closely monitoring these reports to gauge whether the current favorable trends can be sustained. As always, the market's trajectory will be influenced by a myriad of factors, from corporate earnings to macroeconomic indicators.
In conclusion, while the market currently enjoys the favorable side of the peak with descending inflation and ascending equities, vigilance remains essential. Investors should stay informed and be prepared to adapt to changing conditions. The interplay between inflation, interest rates, corporate earnings, and sector performance will continue to shape the financial landscape in the coming months. As history has shown, peaks and valleys are part of the journey, and navigating them successfully requires a keen understanding of the underlying dynamics.
AI stock picks for the week (Large Cap S&P 500)


