
The Monday Charge: March 18, 2024
As the financial world marks the one-year anniversary of Silicon Valley Bank's collapse, the landscape bears little resemblance to the chaos witnessed last spring.

This is our Monday article, focusing on the large cap S&P 500 index. Just the information you need to start your investing week. As always, 100% generated by AI and Data Science, informed, objective, unbiased, and data-driven.
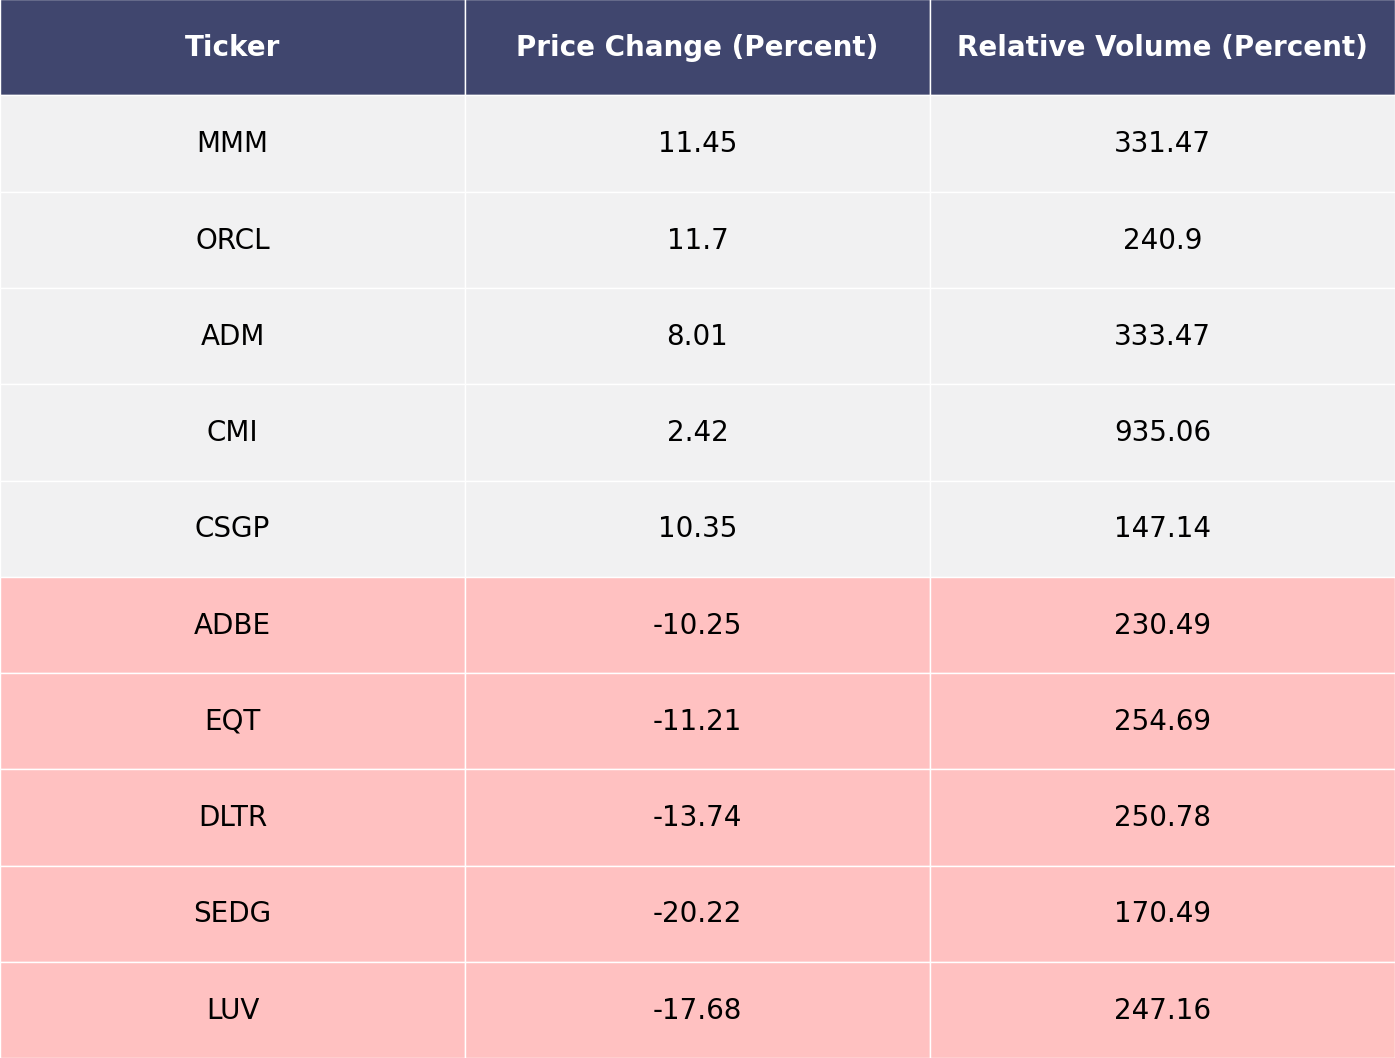
The biggest movers last week on price and volume (Large Cap S&P 500)
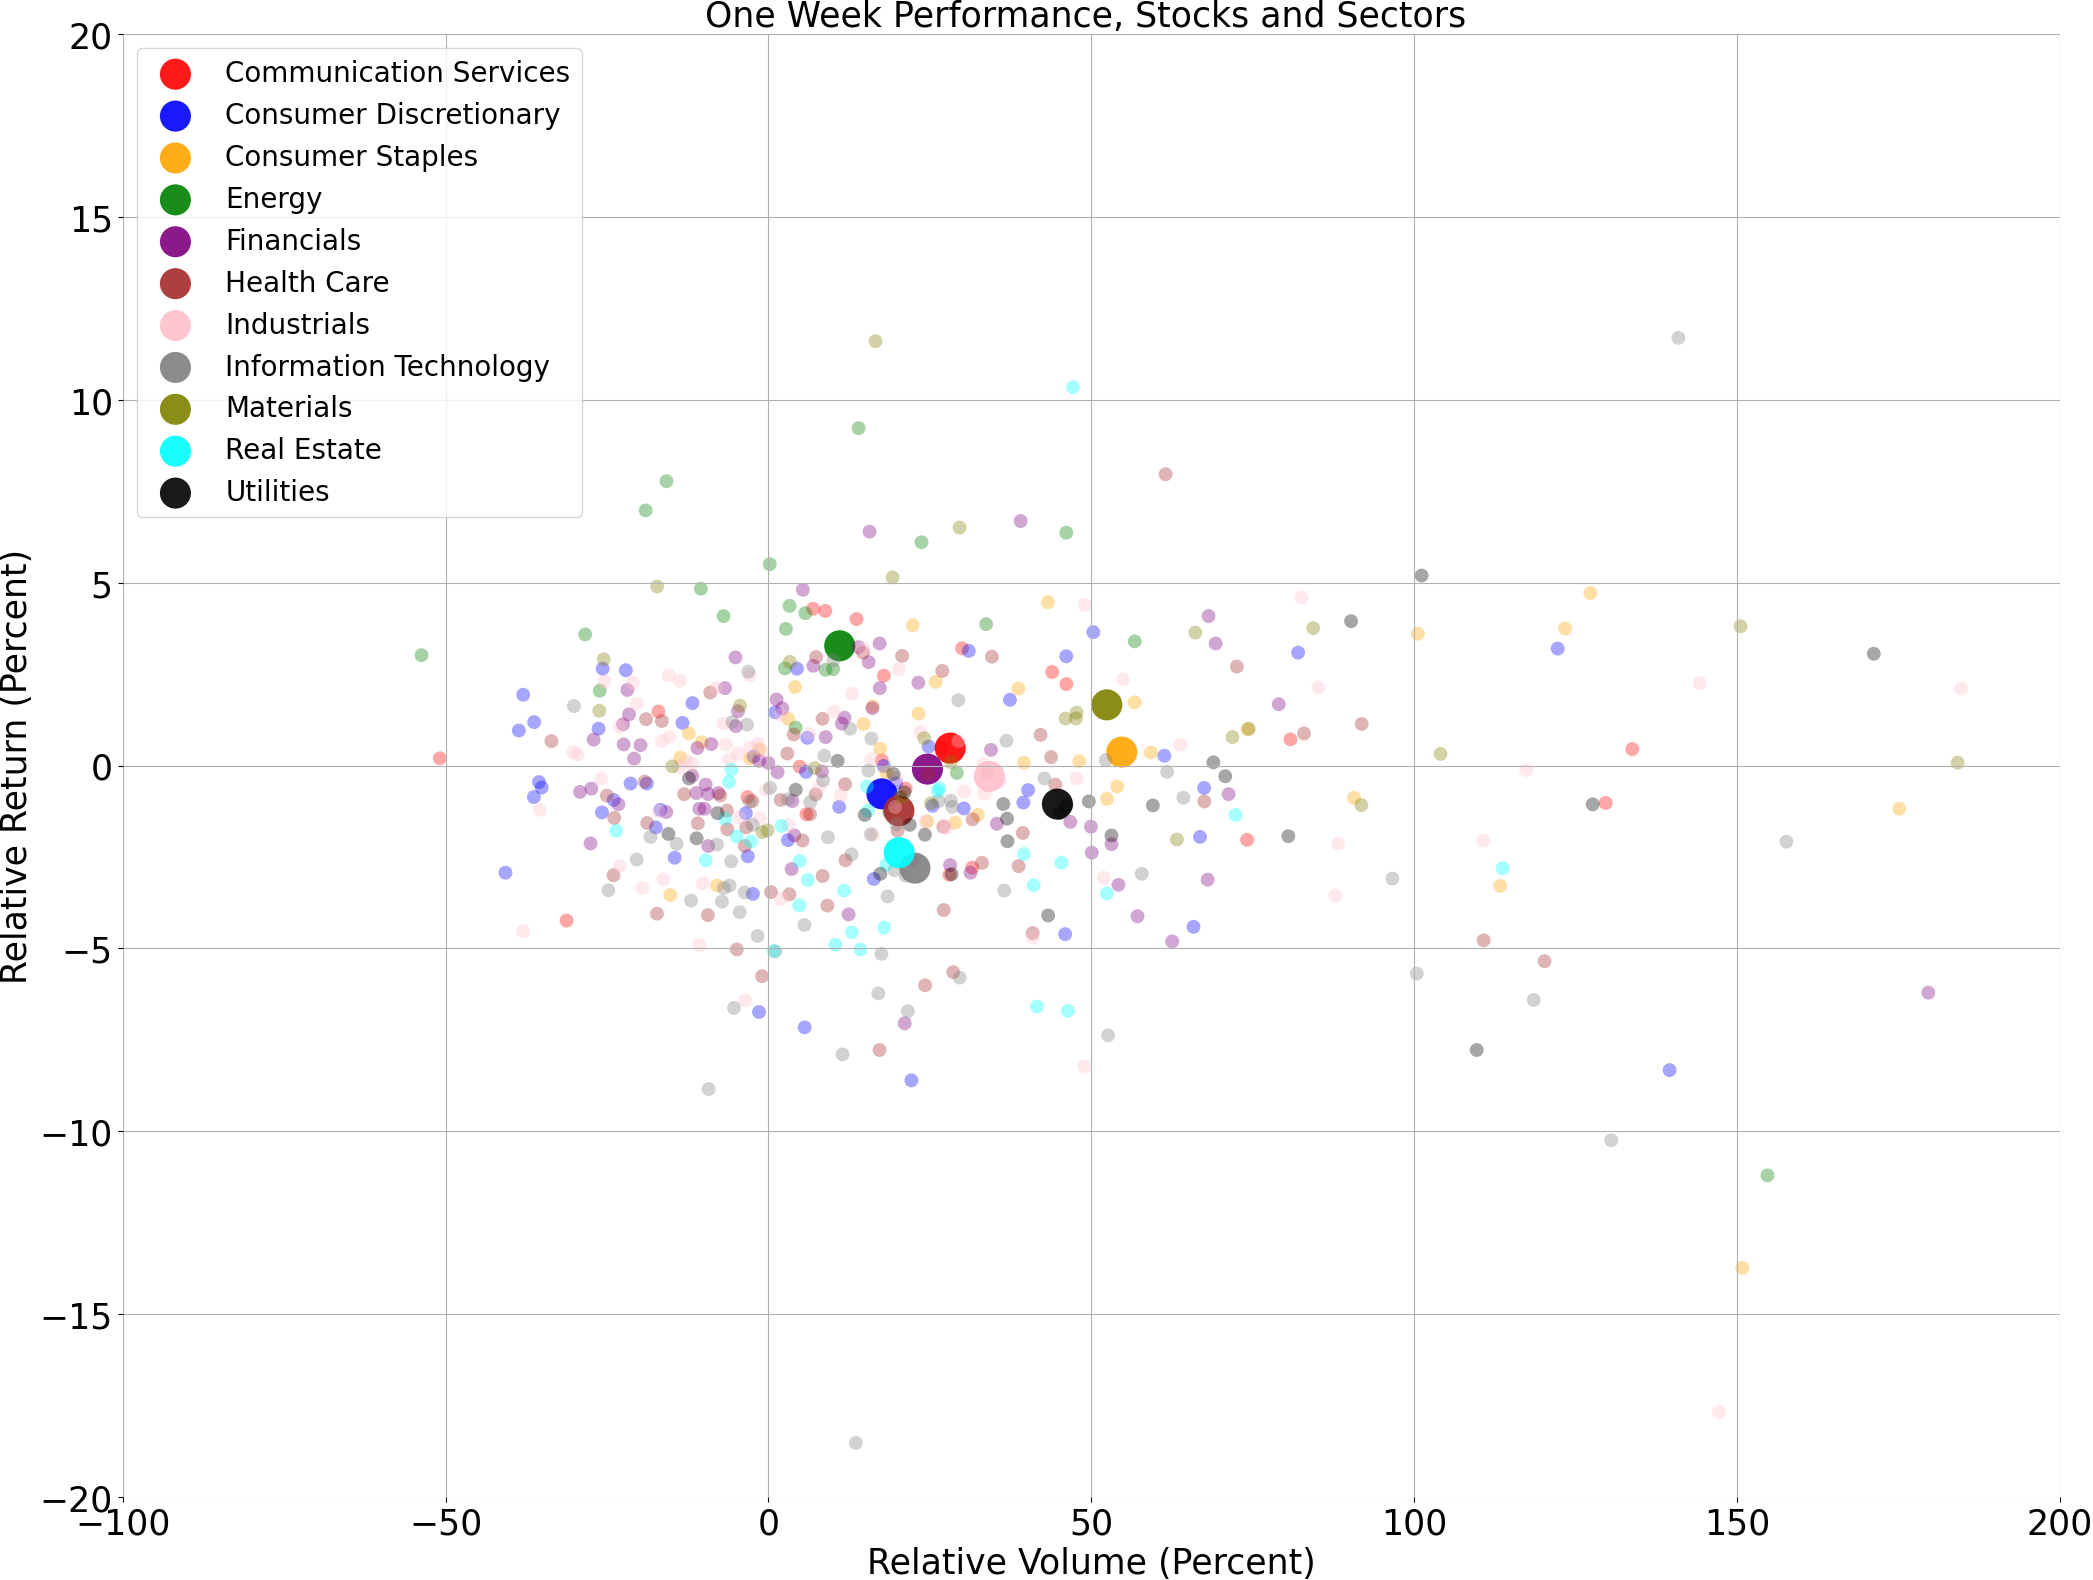
Price and volume moves last week for every stock and sector (Large Cap S&P 500)
A technical analysis across indices
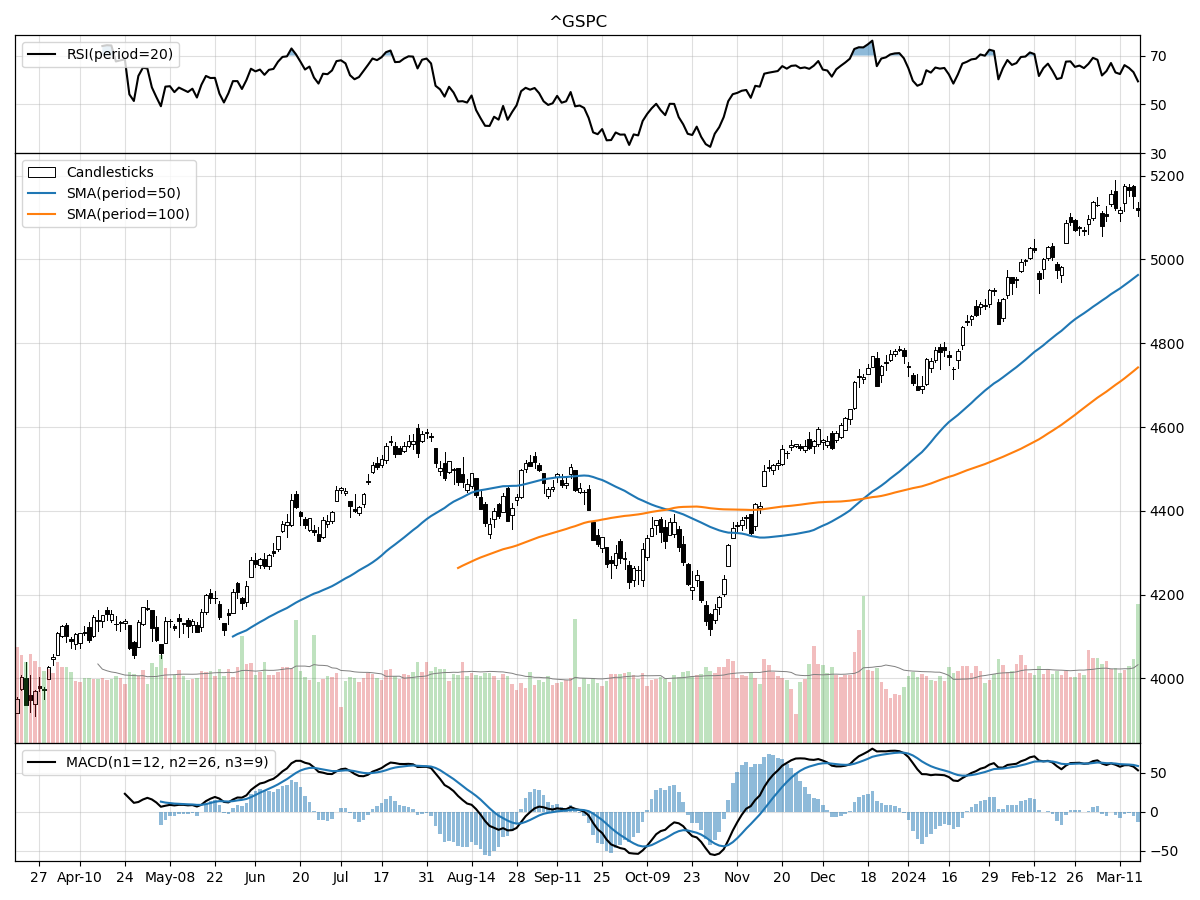
S&P500
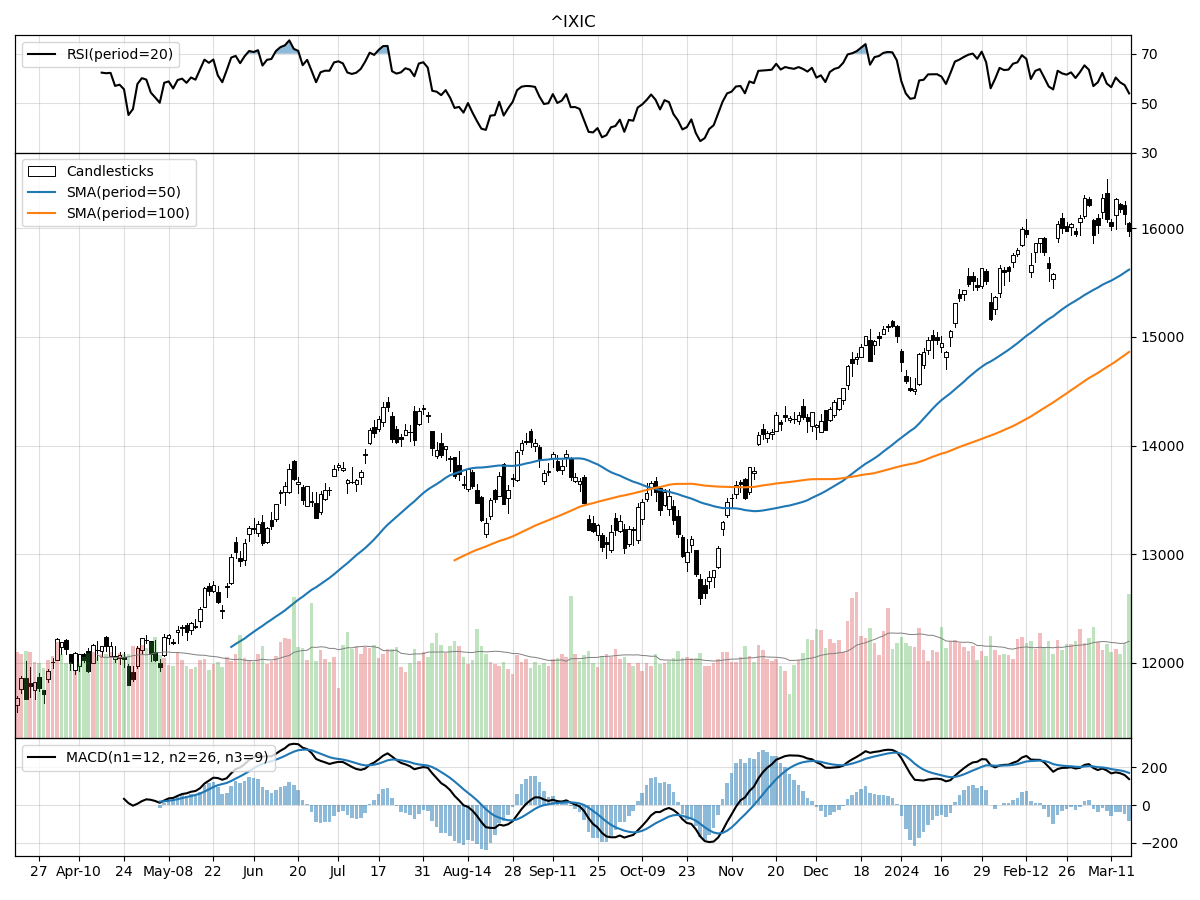
Nasdaq
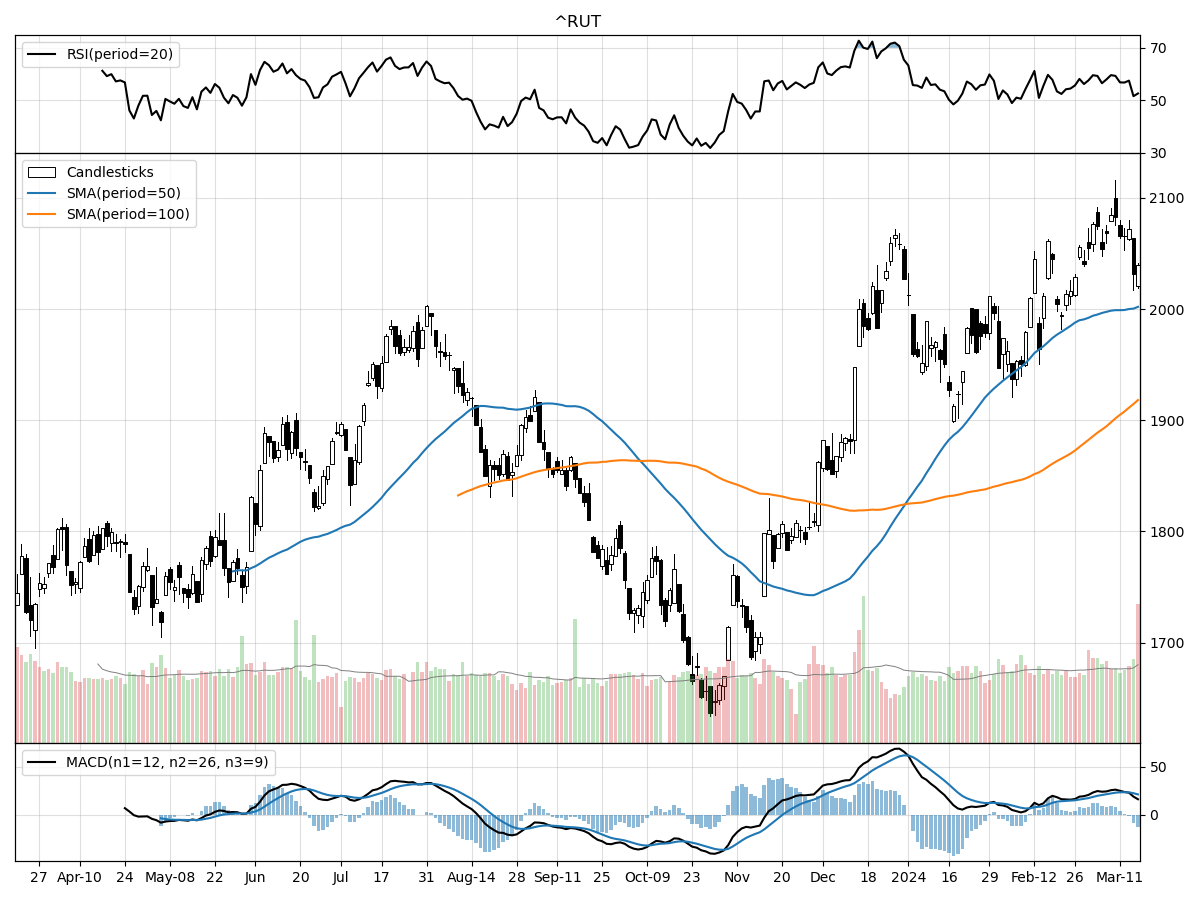
Russell 2000
The technical performance of the S&P 500, Nasdaq, and Russell 2000 indices presents a mosaic of market sentiment and potential future direction. Starting with the S&P 500, the index is currently 1 percent below its 52-week high and 30 percent above its 52-week low, indicating a strong upward trend over the past year. Despite a recent plateau in price movement, the 7.31% rise over the last three months, alongside bullish MACD and money flow indicators suggesting moderate selling pressure but also accumulation, paints a picture of cautious optimism among investors.
In contrast, the Nasdaq has outperformed the S&P 500 in terms of proximity to its 52-week high, sitting just 1 percent below it and a notable 37 percent above its 52-week low. This might suggest that the technology-heavy Nasdaq has had robust growth, with a 6.47% increase over the past three months. However, contrasting money flow indicators point to both moderate buying pressure and distribution, which could signal a more divided sentiment among investors about the future performance of the index. The bullish MACD indicates that momentum remains positive, but the mixed signals from money flow indicators could suggest potential for volatility or a shift in trend.
The Russell 2000 index, which tracks smaller cap companies, is slightly lagging, being 2 percent below its 52-week high and 24 percent above its 52-week low. The smaller relative increase from its low suggests a more cautious approach from investors towards small-cap stocks. Stability in price over both the last month and the last three months could indicate a consolidation phase or uncertainty in the market's direction for these companies. Despite this, the bullish MACD and indicators of moderate buying pressure and accumulation suggest that investors are still generally optimistic about the growth potential of small caps.
In summary, all three indices are currently experiencing bullish momentum, but the S&P 500 and Nasdaq show more robust growth and a higher level of confidence from investors, as evidenced by their closer proximity to 52-week highs. The Russell 2000's performance reflects a more tempered view of the small-cap sector, with steadier price movement and slightly less aggressive bullish signals. Investors might be more selective or cautious in this space, possibly due to perceived risks or the current economic climate's impact on smaller companies.
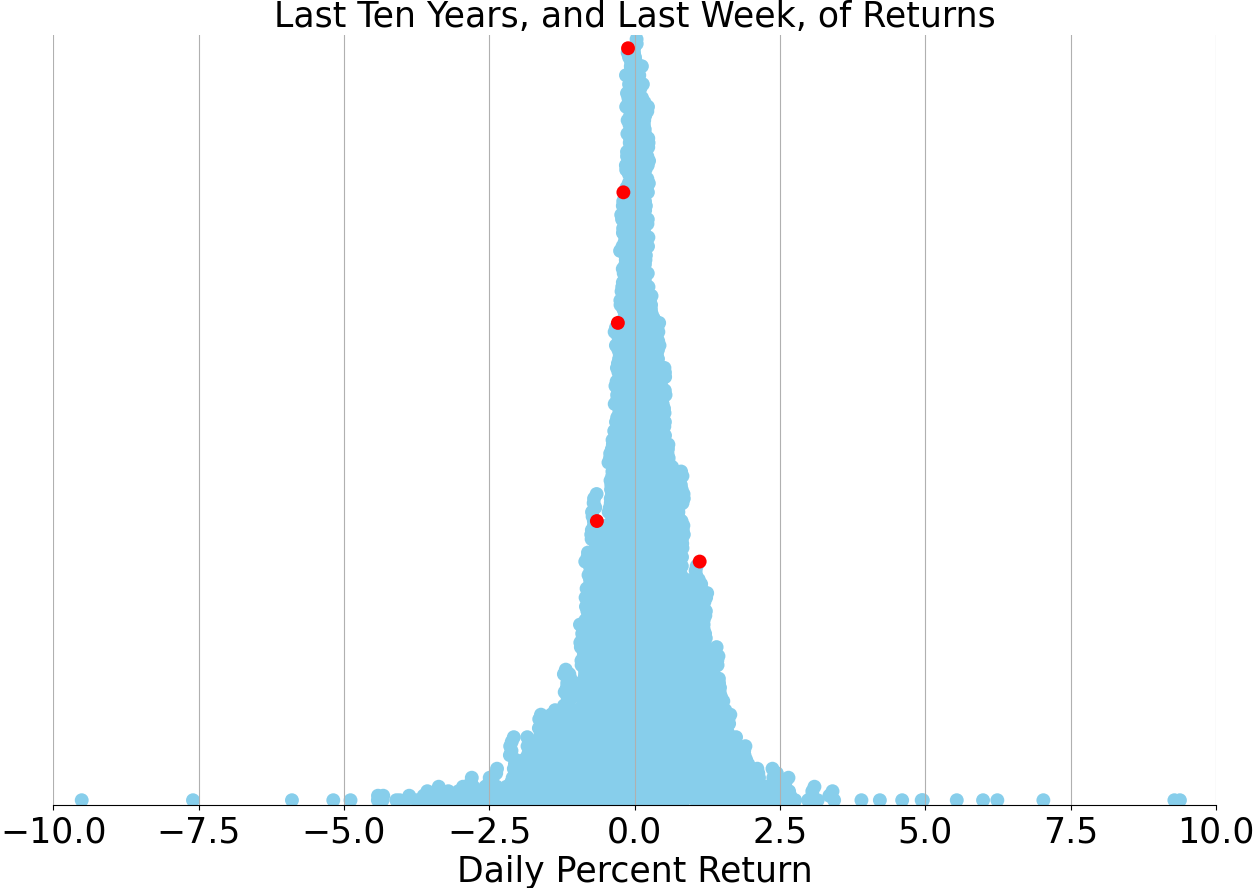
Last week vs. history (Large Cap S&P 500)
Market Commentary
Bull Market Surge: A Year After Silicon Valley Bank's Collapse
As the financial world marks the one-year anniversary of Silicon Valley Bank's collapse, the landscape bears little resemblance to the chaos witnessed last spring. The tumultuous period, which saw the downfall of several regional banks, has given way to a resurgent bull market, reminiscent of the roaring 1990s. This rally serves as a potent reminder of the merits of perseverance in the face of market panic.
Financial Stability Regained
The banking sector, which was the epicenter of last year's crisis, has demonstrated remarkable resilience. The St. Louis Fed Financial Stress Index, a barometer of systemic strain, has shown a significant decline, signaling a return to stability. Furthermore, U.S. banks have seen an improvement in unrealized losses on bond holdings, although these figures still bear the scars of heightened interest rates.
Deposits and Loans: A Sign of Confidence
In the aftermath of the initial bank runs, a sense of normalcy has returned to deposit levels at U.S. commercial banks, which have not only stabilized but also begun to climb. This rebound is mirrored in the lending landscape, with both commercial and consumer loan growth indicating robust demand and a renewed willingness by banks to extend credit.
Stock Market's Remarkable Recovery
On Wall Street, the S&P 500 Index has soared to unprecedented heights, powered by investor optimism and anticipation of forthcoming rate cuts by the Federal Reserve. The index's performance over the past year, with gains approximating 30%, underscores the lucrative opportunities that can arise from episodes of short-lived volatility.
Inflation and Interest Rates: The Fed's Balancing Act
Despite the positive momentum, inflation continues to hover above desired levels, propelled in part by persistent shelter costs. The year-over-year increase in core CPI, coupled with a significant rise in the shelter index, suggests that the Federal Reserve's battle against inflation is far from over.
Economic Growth: Defying Expectations
The U.S. economy has demonstrated a surprising tenacity, with real GDP growth maintaining a strong pace throughout 2023. This vigor is reflected in the U.S. Citi Economic Surprise Index, which indicates that recent economic data has, on average, surpassed analysts' forecasts.
Looking Ahead: A Cautious Optimism
While the current climate exudes confidence, investors remain vigilant. The lessons of the past year have emphasized the importance of a diversified portfolio and a long-term perspective. As we brace for the release of crucial housing data and the outcomes of the latest FOMC meeting, the market's resilience will once again be put to the test. Despite the challenges ahead, the prevailing sentiment is one of cautious optimism, as the financial sector continues to navigate a landscape transformed by crisis and recovery.
AI stock picks for the week (Large Cap S&P 500)


