
The Monday Charge: June 3, 2024
n the past week, Wall Street faced a mild stumble, with stocks grappling against an uptick in interest rates. This shift is largely fueled by ongoing positive economic momentum and pockets of persistent inflation...

This is our Monday article, focusing on the large cap S&P 500 index. Just the information you need to start your investing week. As always, 100% generated by AI and Data Science, informed, objective, unbiased, and data-driven.
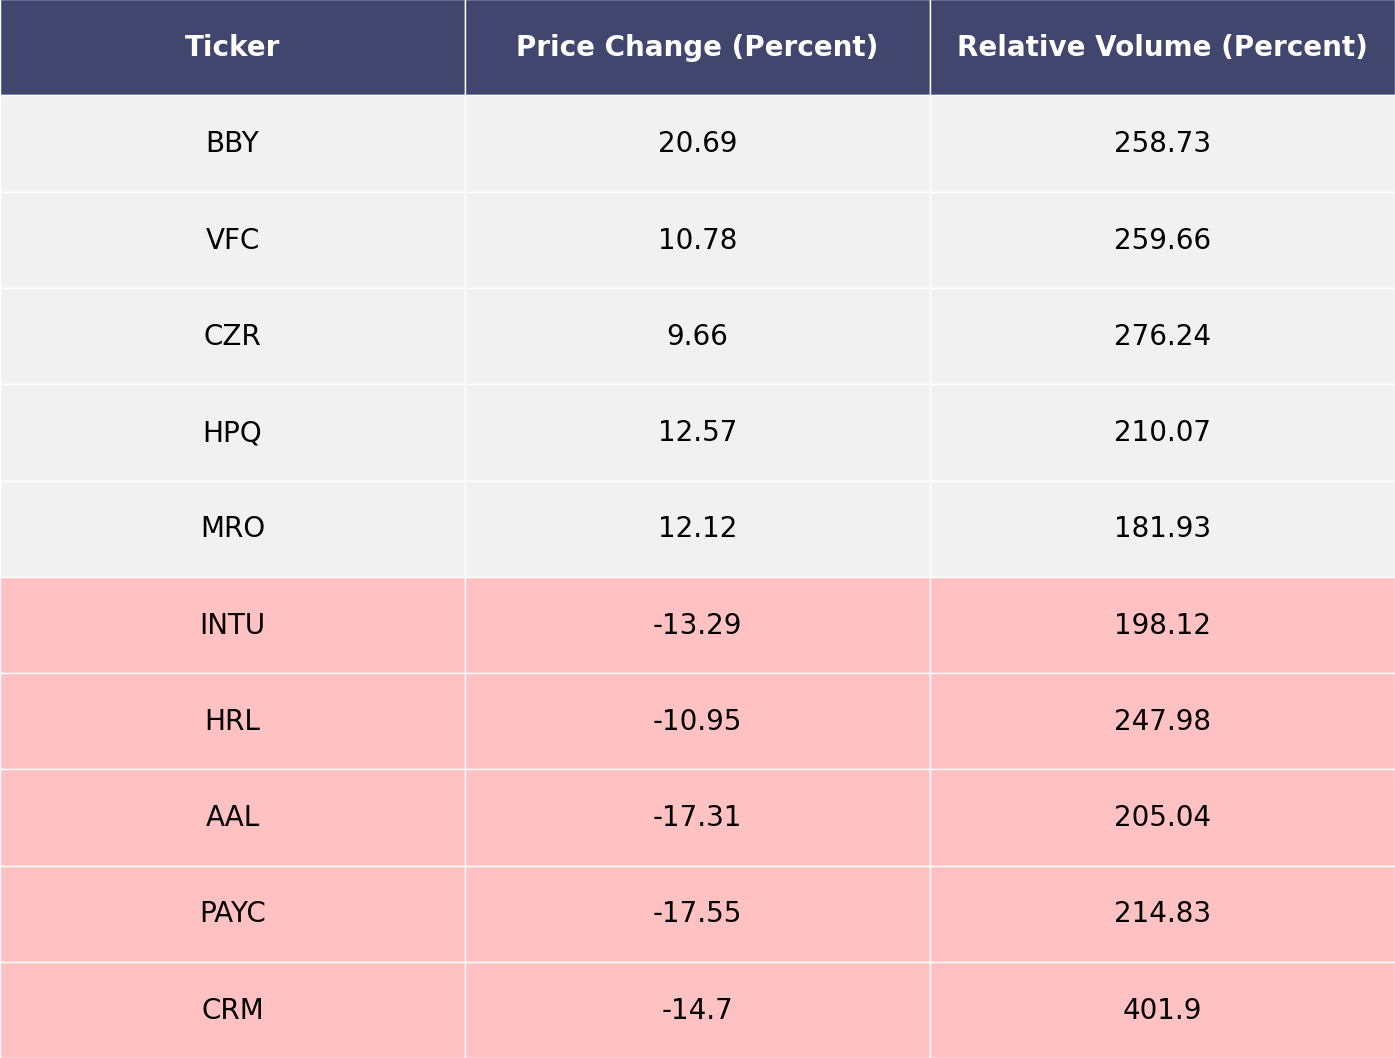
The biggest movers last week on price and volume (Large Cap S&P 500)
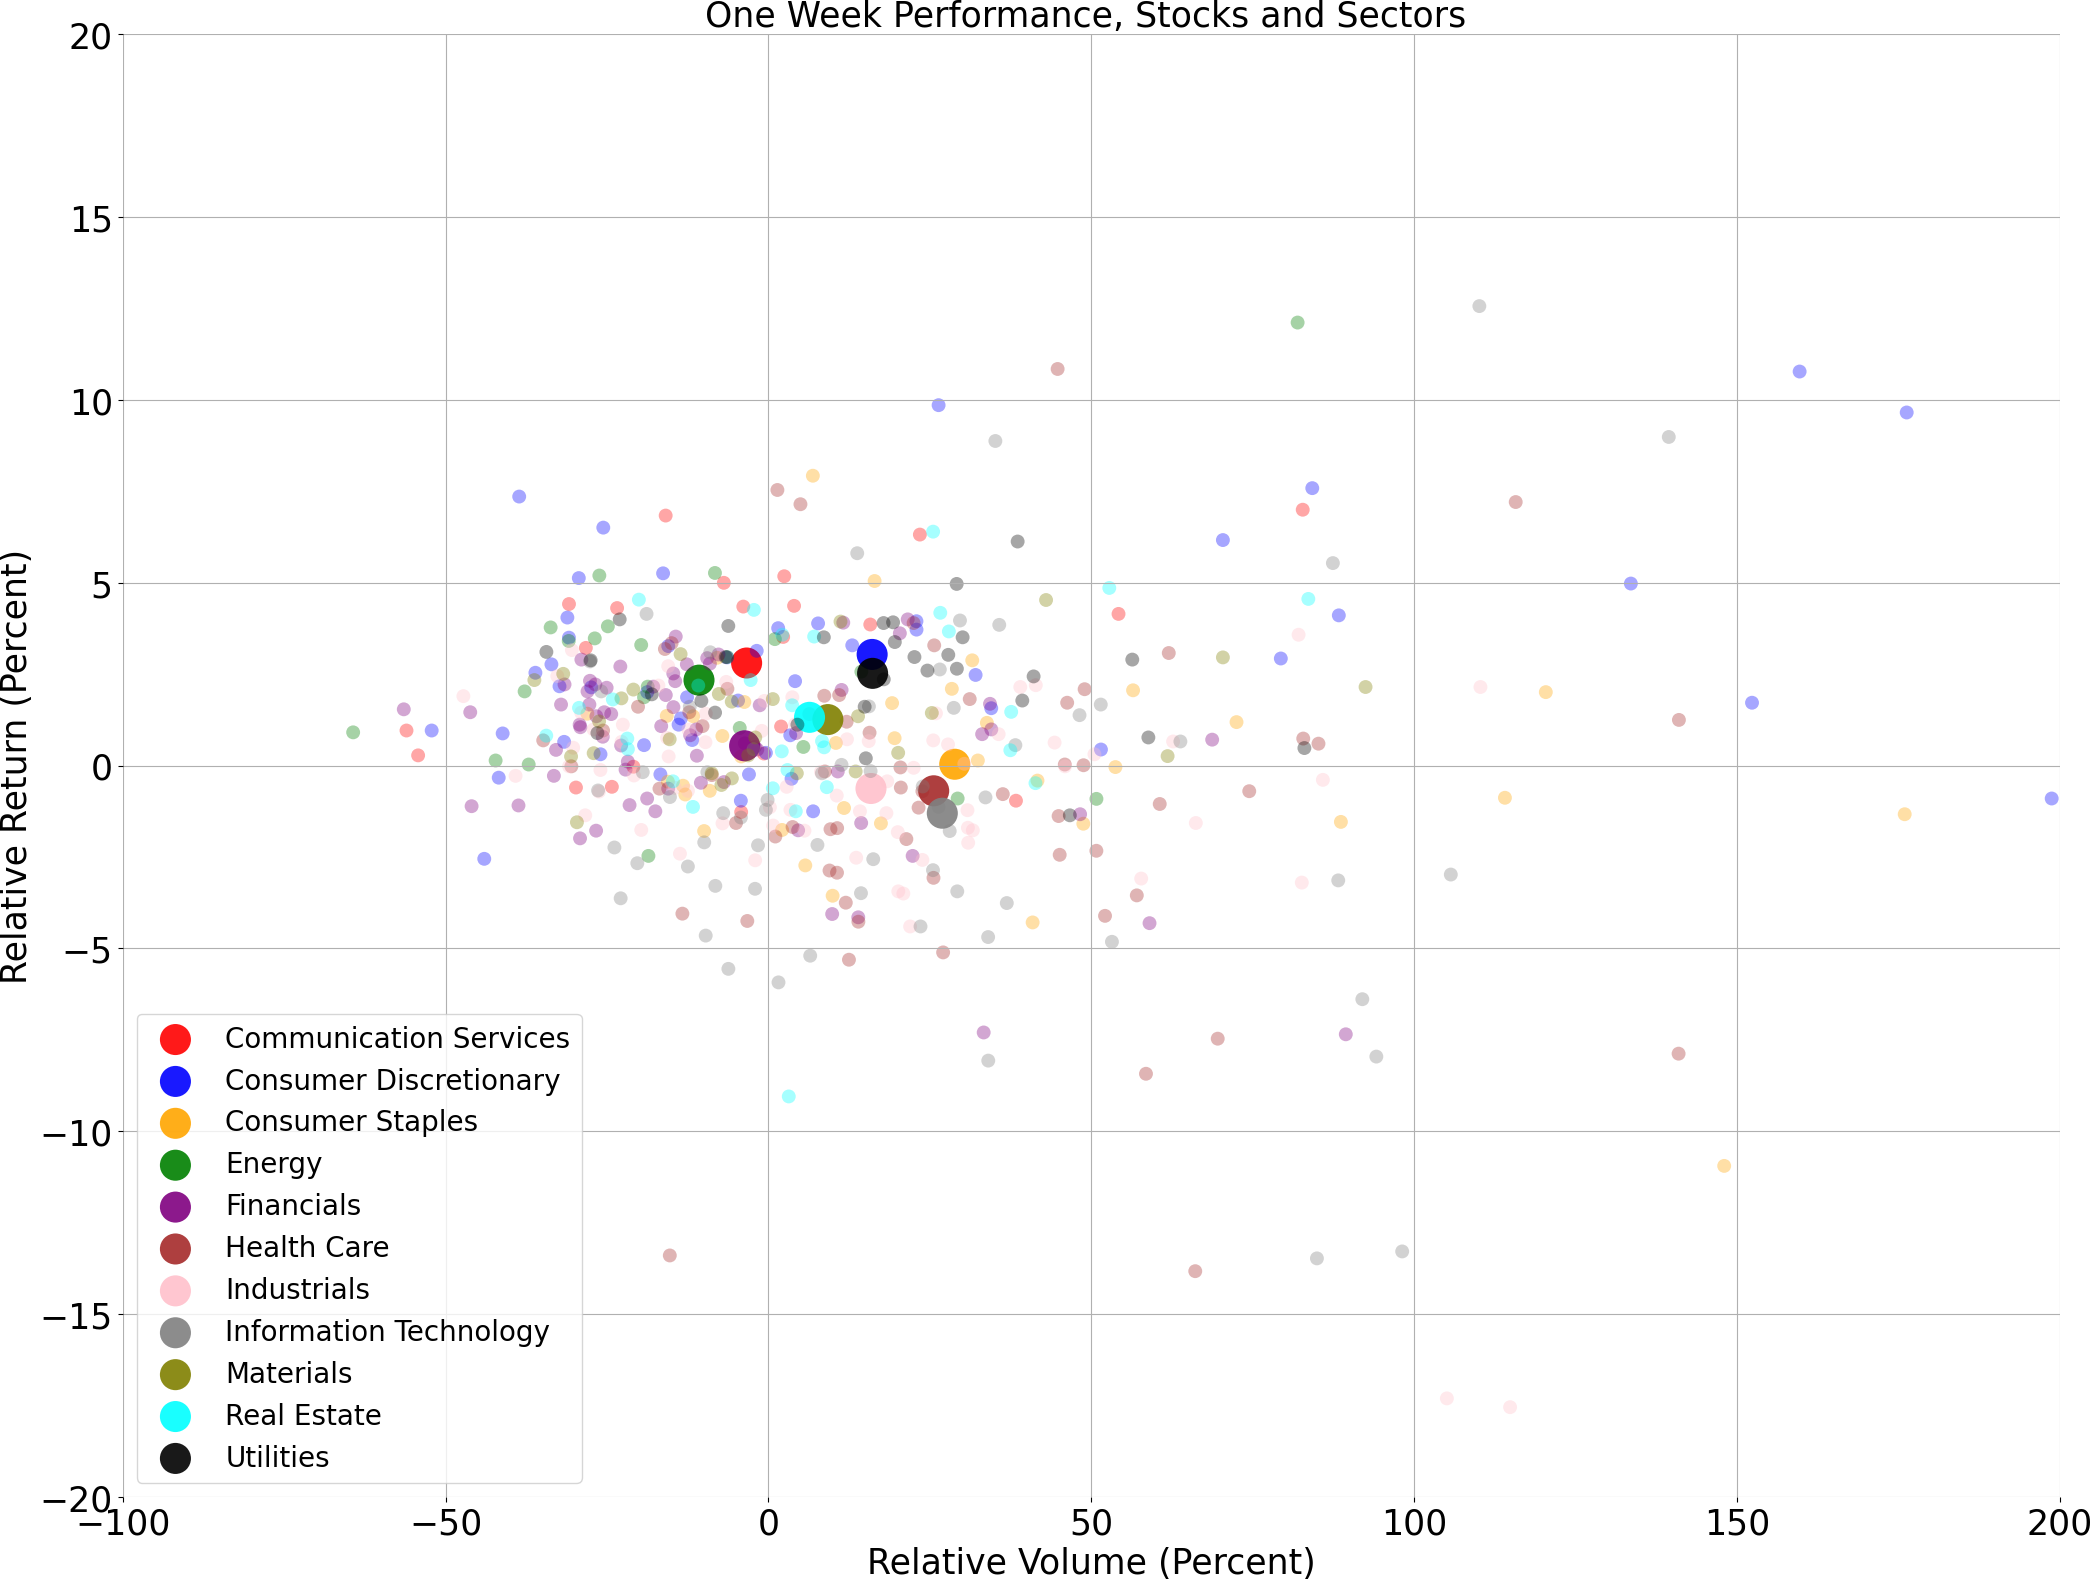
Price and volume moves last week for every stock and sector (Large Cap S&P 500)
A technical analysis across indices
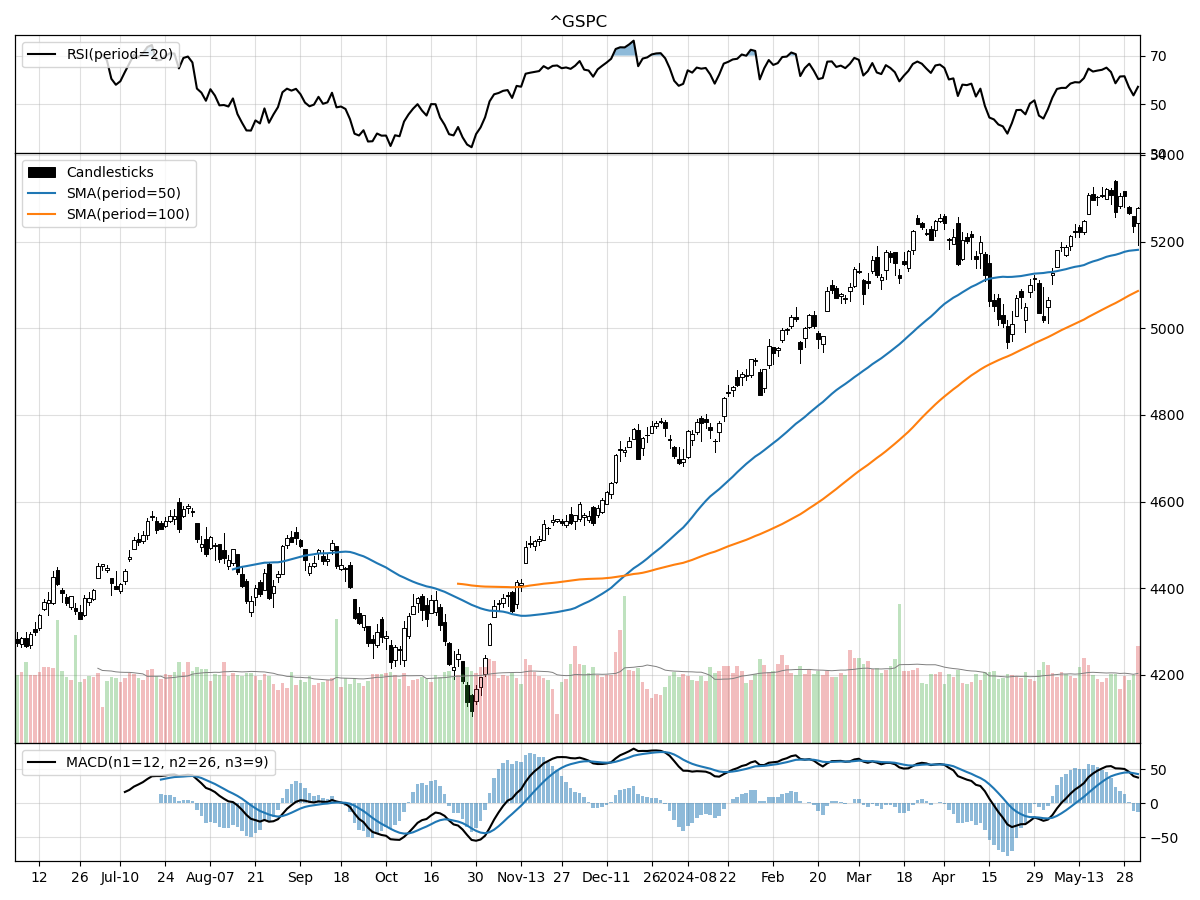
S&P500
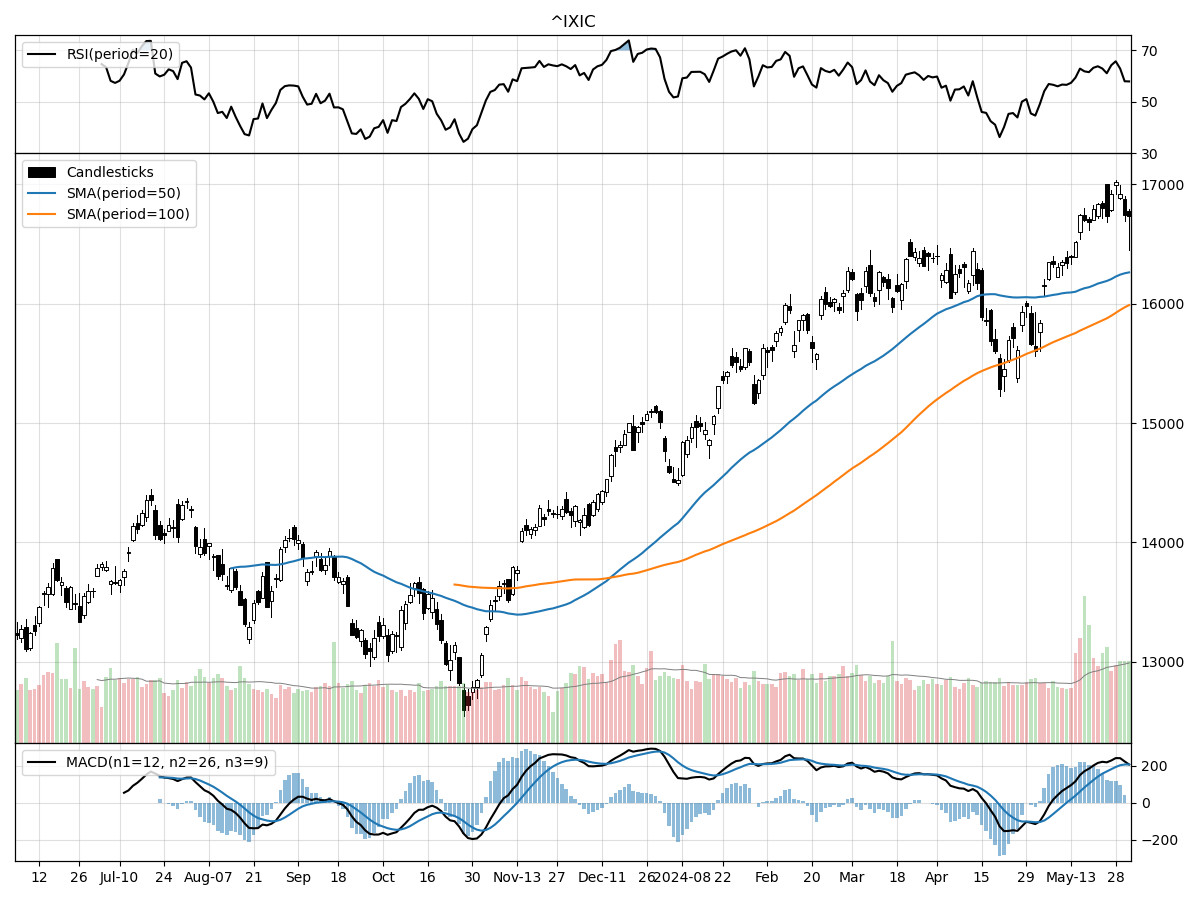
Nasdaq
Russell 2000
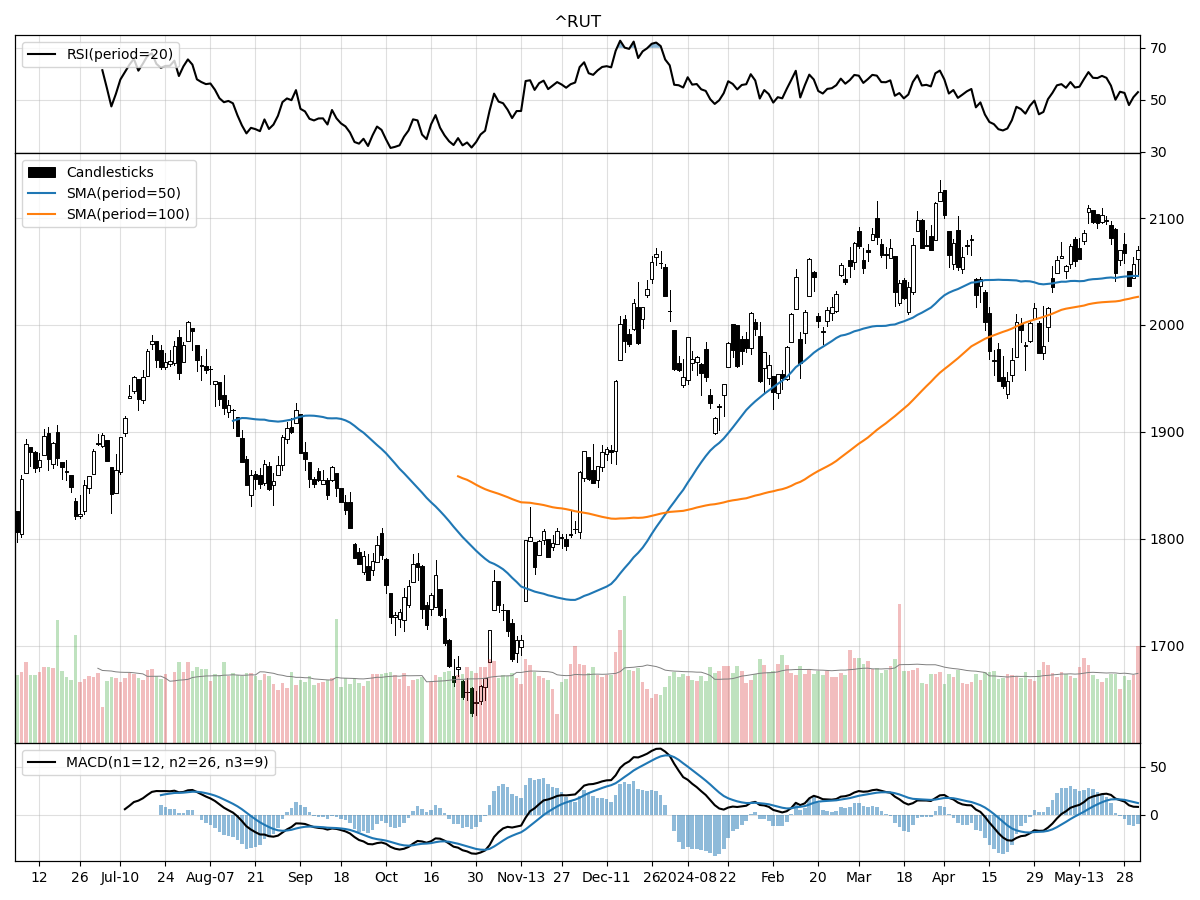
When analyzing the technical performances of the S&P 500, Nasdaq, and Russell 2000 Small Cap indices, several key similarities and differences stand out. All three indices are currently trading significantly above their 52-week lows and near their 52-week highs, indicating strong overall market performance. Specifically, the S&P 500 is 28% above its 52-week low and at its 52-week high, the Nasdaq is 32% above its 52-week low and 1% below its 52-week high, and the Russell 2000 is 26% above its 52-week low and 2% below its 52-week high. This suggests a robust recovery across the market spectrum, with slight variations in performance levels.
Volume trends also reveal interesting insights. The Nasdaq has shown a recent daily volume notably higher than its longer-term average, which may suggest heightened interest and activity in tech-heavy stocks. In contrast, the S&P 500 and Russell 2000 have volumes that are relatively stable and close to their long-term averages. Furthermore, Money Flow indicators show all three indices under moderate buying pressure, although the Russell 2000 is uniquely under distribution, suggesting that while there is buy-side interest, there may be significant selling pressure as well. Meanwhile, both the S&P 500 and Nasdaq are under accumulation, indicating stronger, more sustained buying activity. Lastly, the MACD for all three indices is bullish, reinforcing a positive outlook, but the magnitude varies with the Nasdaq having the highest bullish MACD at 207.9, suggesting stronger momentum in comparison to the S&P 500 and Russell 2000.
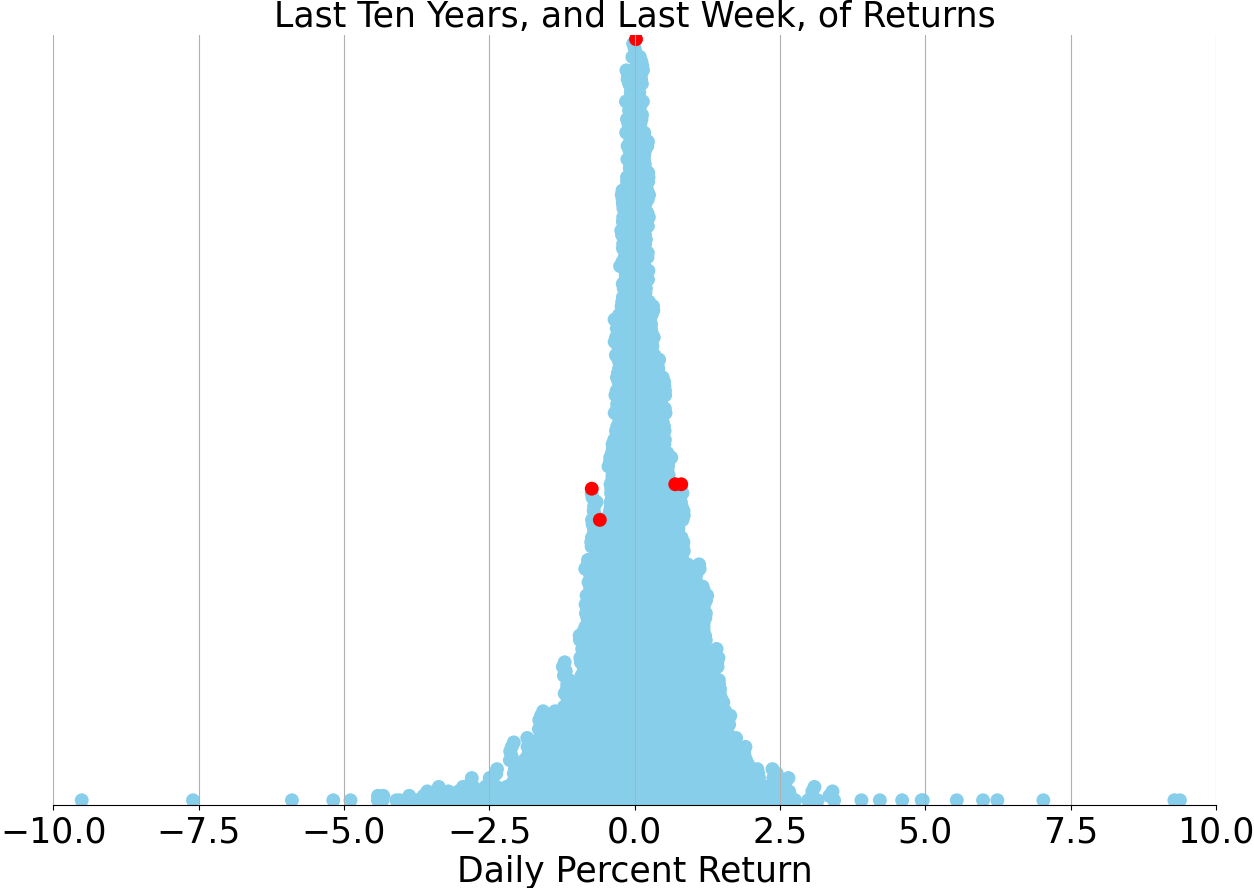
Last week vs. history (Large Cap S&P 500)
Market Commentary
In the past week, Wall Street faced a mild stumble, with stocks grappling against an uptick in interest rates. This shift is largely fueled by ongoing positive economic momentum and pockets of persistent inflation. While the recent inflation figures aligned with expectations, a series of disappointing corporate earnings reports dampened market performance. Amid the buzz surrounding the Federal Reserve's potential rate cut and the fervor around artificial intelligence, there's a broader narrative at play in the market.
Historically, the S&P 500 has seen larger intra-year pullbacks, but 2024 has been relatively mild with a maximum decline of just 5.5%. This is significantly low compared to historical standards, suggesting a period of unusual market stability. However, it's crucial to remember that past performance is not a guarantee of future outcomes. Investors should remain vigilant and consider the broader economic context when making decisions.
This year has also been marked by a lack of sharp daily fluctuations in the S&P 500. Data shows a notable reduction in the number of days the index moved up or down by 2% or more, compared to previous years. This could indicate a more stable market environment, but it also raises questions about the potential for volatility in the near future. Investors might find this stability reassuring, but should also prepare for any sudden shifts.
Despite the allure of high yields in low-risk investments, equities have significantly outperformed other asset classes. From October 2022 to May 2024, U.S. large-cap stocks have led the pack, outpacing cash, short-term investment-grade bonds, and investment-grade bonds. This trend underscores the enduring appeal of equities, even amidst economic uncertainties. However, investors should be cautious and diversify their portfolios to mitigate potential risks.
Year-to-date gains in the stock market have been driven by a variety of sectors. Financials, utilities, energy, industrials, and consumer staples have all shown strong performance. This broad-based growth suggests a healthy, diversified market, rather than one overly reliant on a single sector. It also highlights the importance of sectoral analysis in making informed investment decisions.
Throughout 2023, market leadership was narrowly concentrated, with specific sectors driving most of the gains. However, recent trends indicate a broadening of this leadership as lagging sectors begin to catch up. This shift could signal a more balanced and sustainable market growth moving forward. Investors should monitor these trends closely to identify emerging opportunities.
Looking ahead, important economic releases this week, including the May nonfarm payrolls report and the ISM manufacturing PMI, will provide further insights into the health of the economy. These reports could influence market sentiment and potentially sway the Federal Reserve's policy decisions. Investors should pay close attention to these indicators to better understand the economic landscape.
In conclusion, while the market has shown resilience and stability so far in 2024, there are several factors at play that could influence future performance. The interplay between interest rates, corporate earnings, and sectoral performance will be crucial in shaping market dynamics. Investors should stay informed and consider a diversified approach to navigate the complexities of the current economic environment. As always, past performance is not indicative of future results, and careful consideration of risks is essential.
AI stock picks for the week (Large Cap S&P 500)


