
The Monday Charge: June 24, 2024
The U.S. consumer has been a cornerstone of economic growth over the past three years, driving robust domestic momentum and supporting global expansion. This resilience is particularly notable given the dual headwinds of elevated inflation and high interest rates.

This is our Monday article, focusing on the large cap S&P 500 index. Just the information you need to start your investing week. As always, 100% generated by AI and Data Science, informed, objective, unbiased, and data-driven.
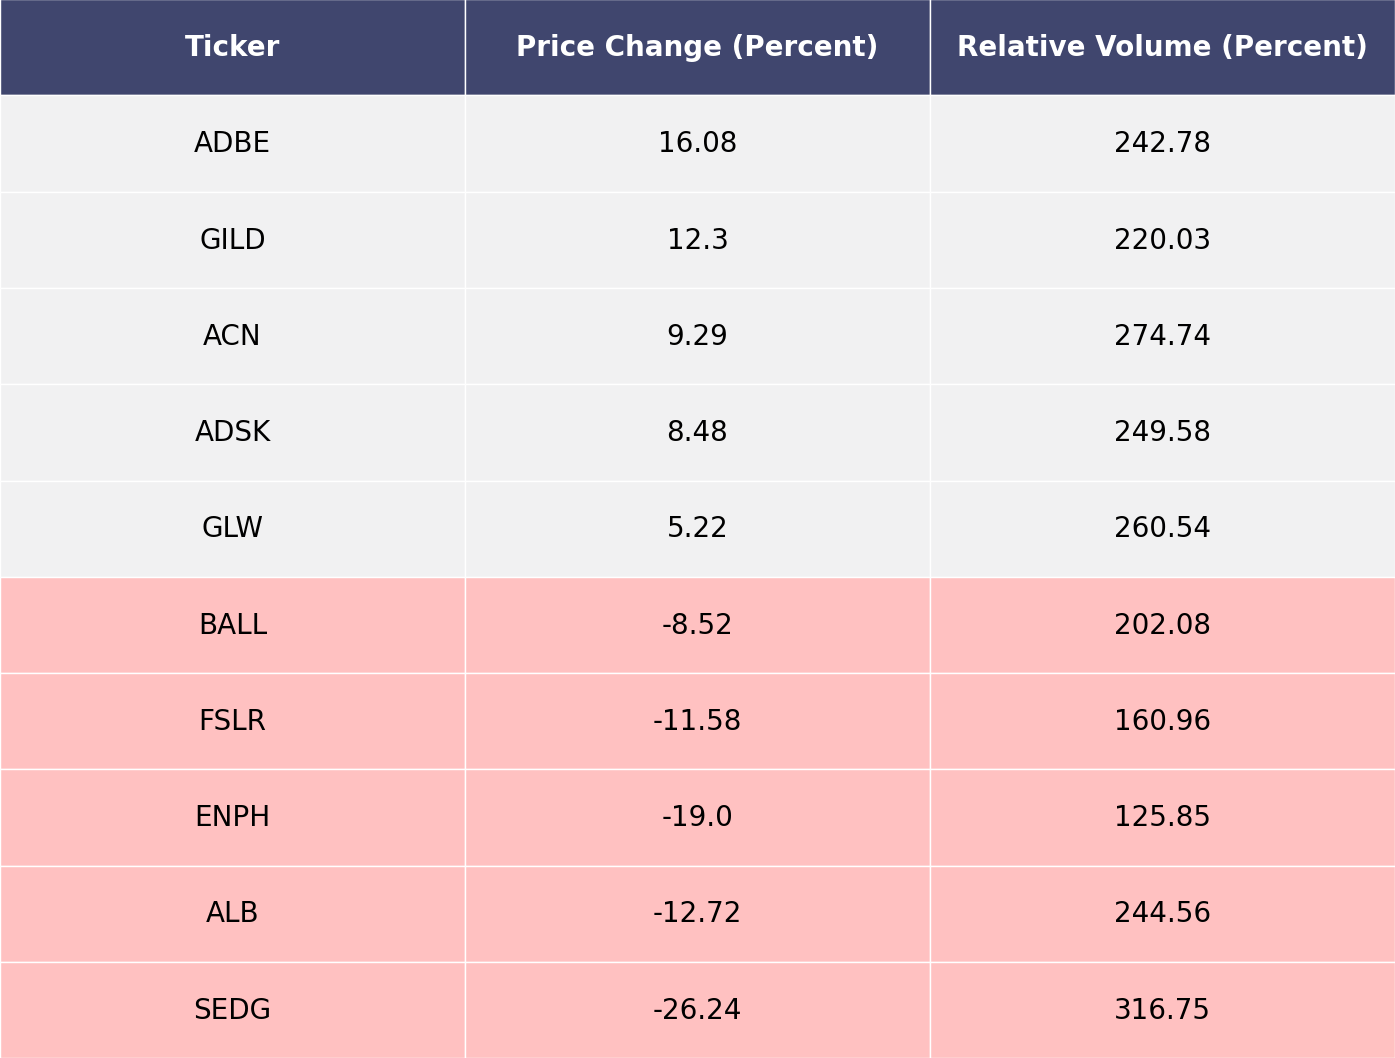
The biggest movers last week on price and volume (Large Cap S&P 500)
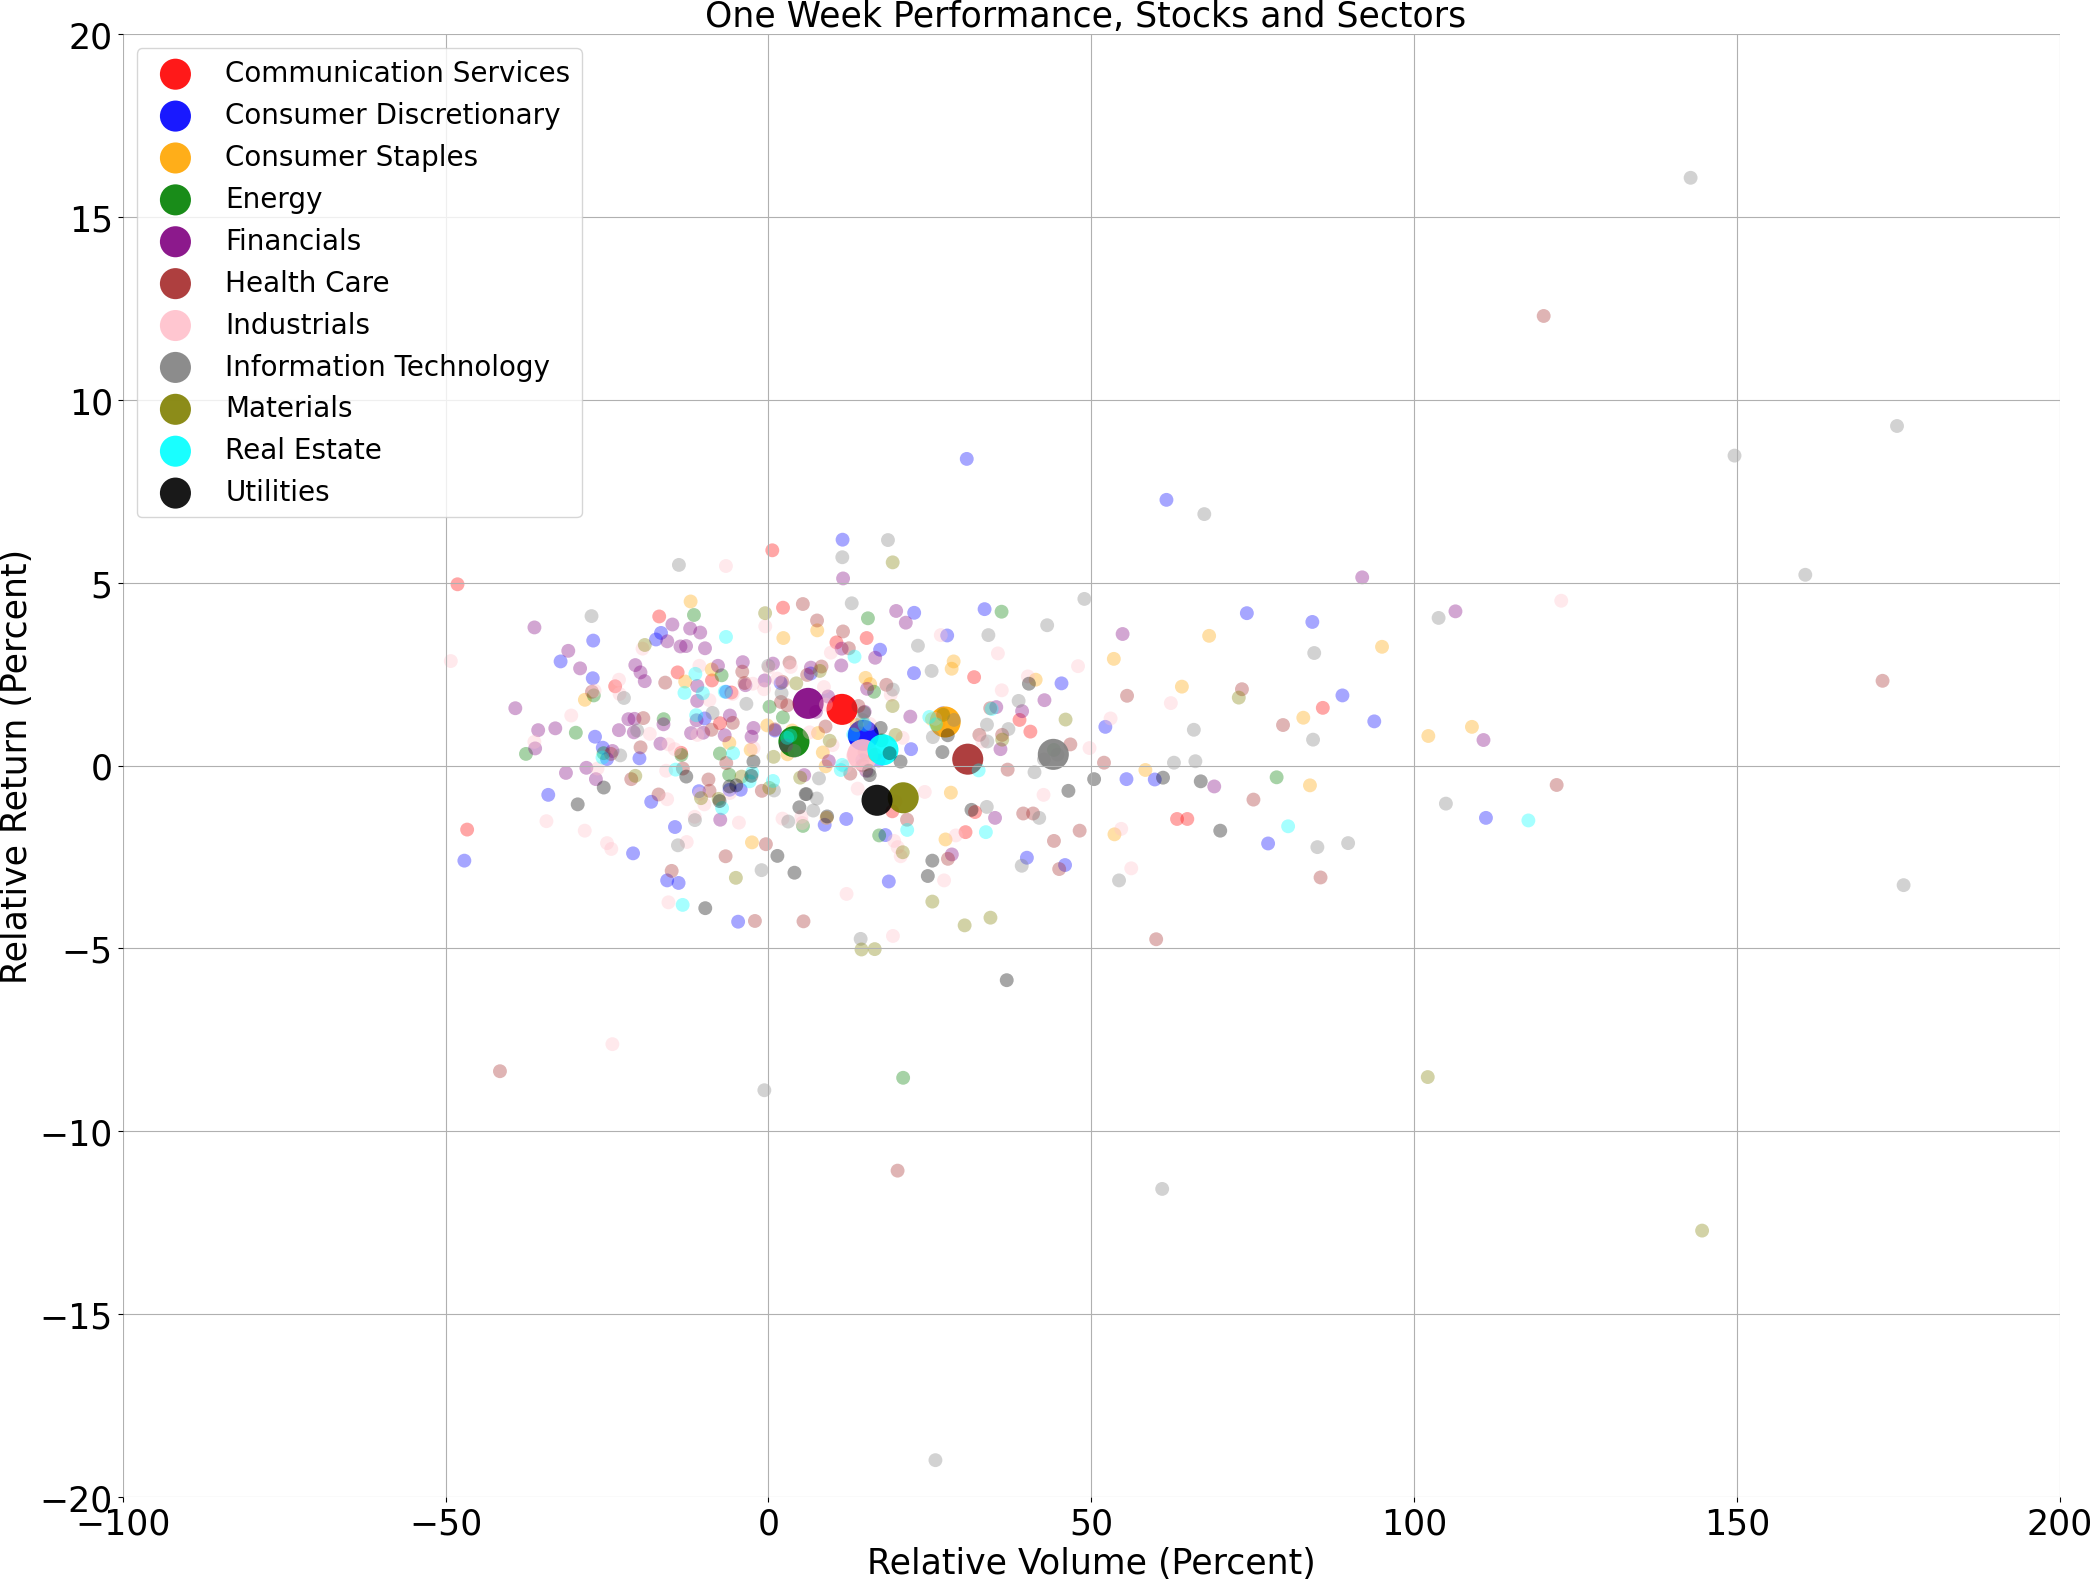
Price and volume moves last week for every stock and sector (Large Cap S&P 500)
A technical analysis across indices
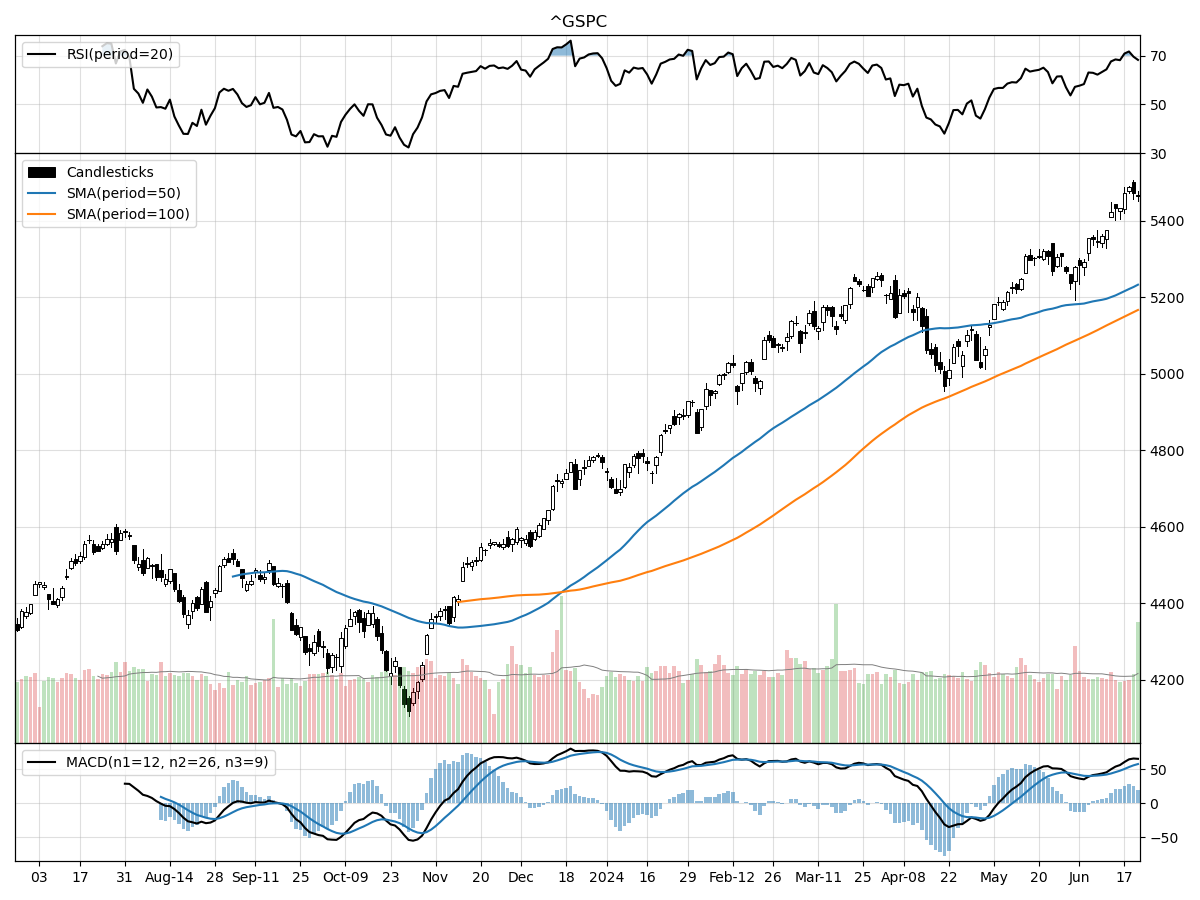
S&P500
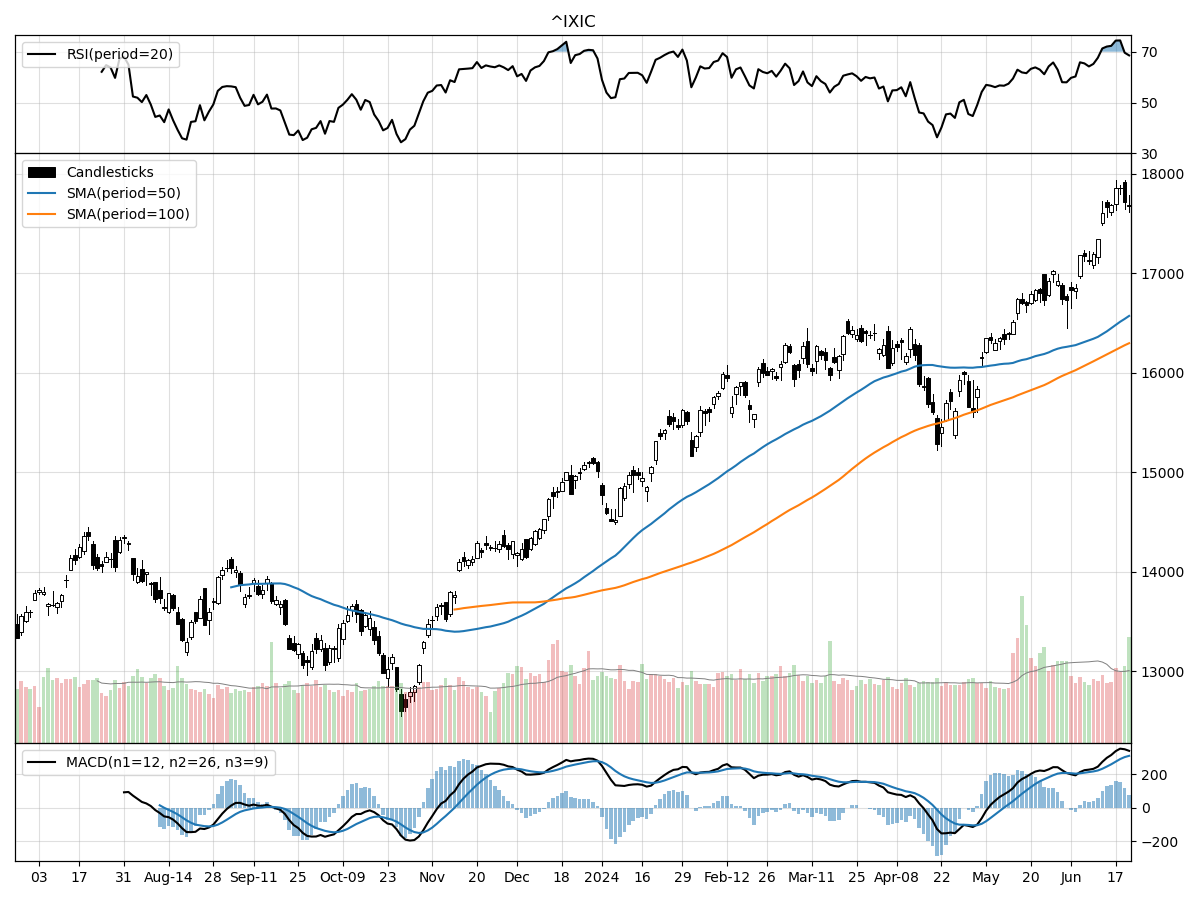
Nasdaq
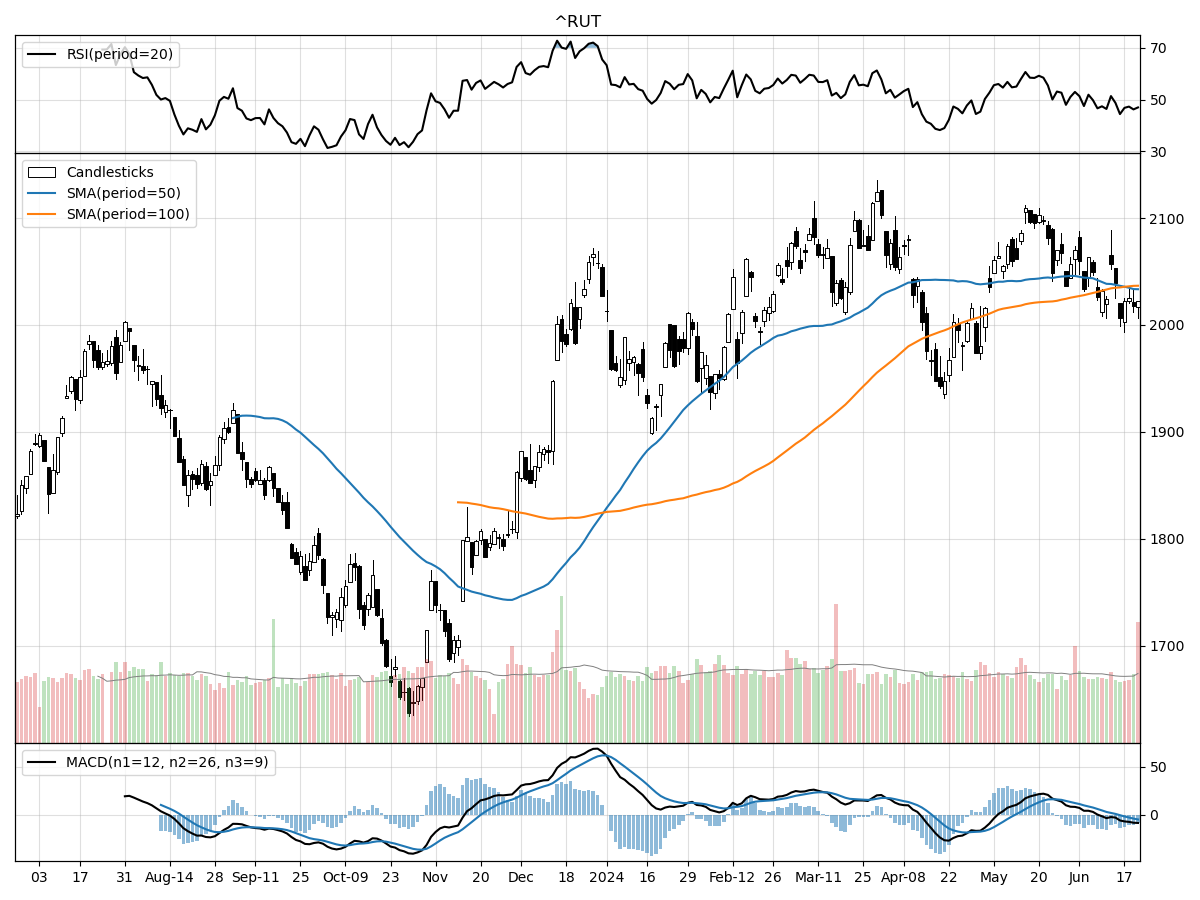
Russell 2000
When we examine the technical performances of the S&P 500, Nasdaq, and Russell 2000 Small Cap indices, distinct patterns emerge that reflect their respective market dynamics. The S&P 500 index is currently trading at 5464.62, placing it at its 52-week high and 32% above its 52-week low. Despite this significant elevation, the index has remained relatively stable over the past month and three months, suggesting a consolidation phase. The Money Flow indicators point to moderate buying pressure, though the RSI indicates the stock is overbought, hinting at the possibility of a near-term pullback. Notably, the MACD is bullish at 57.89, reinforcing a positive short- to medium-term outlook.
In contrast, the Nasdaq index is experiencing a more pronounced upward momentum. Trading at 17689.36, the Nasdaq is also at its 52-week high and 40% above its 52-week low. The index has risen by 5.7% in the last month and 7.87% over the last three months, suggesting robust upward movement. Similar to the S&P 500, the Nasdaq is under moderate buying pressure and is overbought according to the RSI. However, its MACD is significantly more bullish at 310.2, indicating strong positive momentum and likely continued gains if current conditions persist.
The Russell 2000 Small Cap index presents a different scenario. With a current price of 2022.03, it is 4% below its 52-week high and 23% above its 52-week low. The index has remained relatively stable over the past month and three months, mirroring the S&P 500's consolidation phase but without the same level of bullish indicators. The Money Flow indicators show moderate selling pressure, and the RSI indicates a balanced state—not overbought or oversold. The MACD is bearish at -5.08, suggesting a potential for downside movement. Thus, while the S&P 500 and Nasdaq exhibit strong bullish indicators, the Russell 2000 appears to be under more cautious sentiment with potential headwinds ahead.
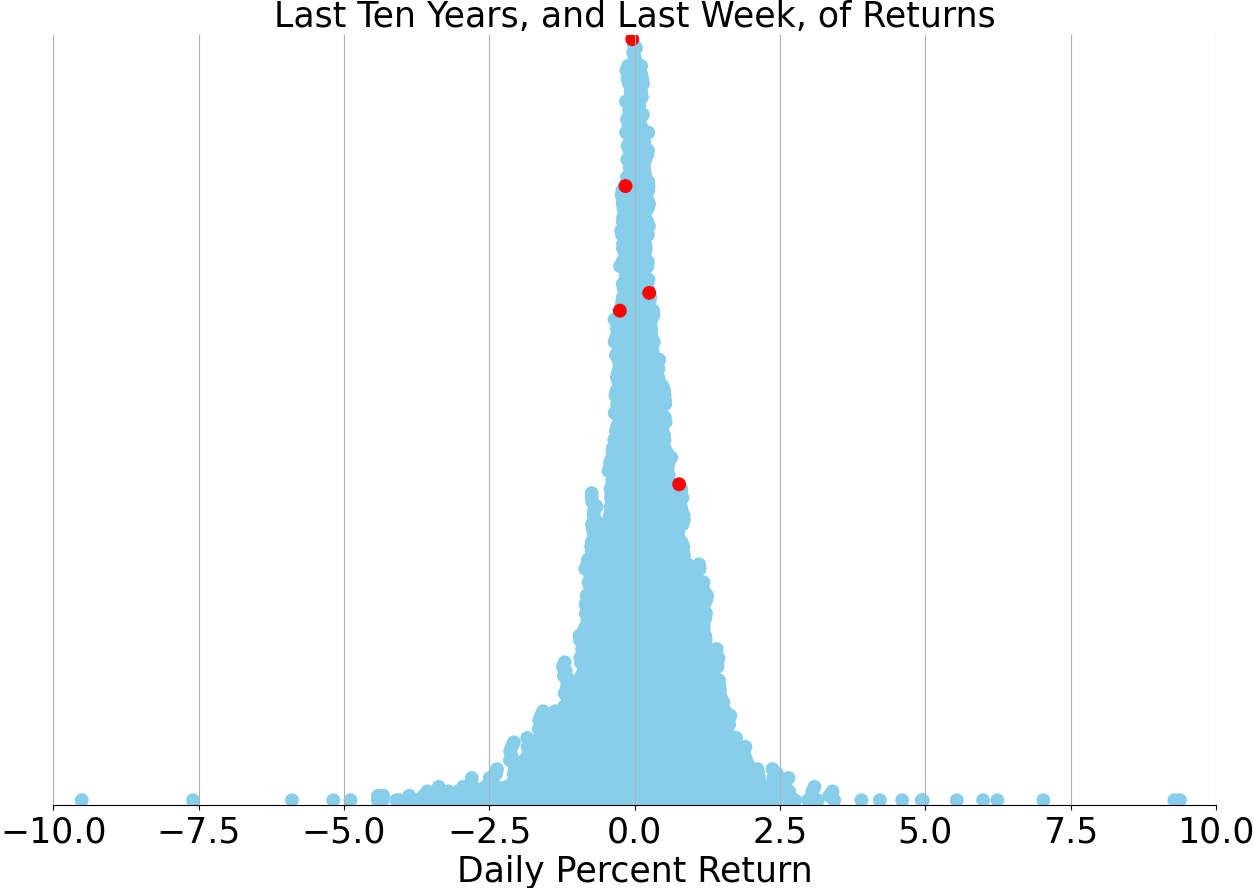
Last week vs. history (Large Cap S&P 500)
Market Commentary
U.S. Consumer Resilience Faces New Challenges Amid Economic Shifts
The U.S. consumer has been a cornerstone of economic growth over the past three years, driving robust domestic momentum and supporting global expansion. This resilience is particularly notable given the dual headwinds of elevated inflation and high interest rates. While the Federal Reserve has currently paused its rate hikes, the effects of previous tightening measures continue to permeate the economy. Early signs of consumer fatigue are emerging, signaling potential shifts in spending behavior. In this context, it is crucial to examine the current state of the consumer, the outlook for spending, and the broader implications for the economy and markets.
Despite a seemingly solid macroeconomic environment, consumer sentiment paints a different picture. The University of Michigan Consumer Sentiment Index fell to a seven-month low in June, reflecting a pessimistic view of personal finances and overall business conditions. This index remains 30% below its pre-pandemic level and only slightly above the average during the 2008–09 recession. Similarly, the Conference Board's consumer confidence index, which is more influenced by employment conditions, is 20% below its pre-pandemic level. This disconnect between macroeconomic indicators and consumer sentiment raises questions about underlying economic dynamics.
One of the primary concerns for consumers is inflation, which, although slowed dramatically since its 2022 peak, remains a significant burden. Low-income households, in particular, are disproportionately affected by the high costs of essentials such as food, gas, and rent. Prices have risen approximately 21% cumulatively since 2020, marking the largest four-year increase in the past 40 years. This persistent inflationary pressure has left consumers feeling the pinch, despite recent wage growth outpacing inflation since mid-2023. For many, the impact of inflation is becoming more pronounced as excess savings deplete.
High mortgage rates and home prices further dampen consumer sentiment, making homebuying unaffordable for many. The labor market, while still relatively strong, is showing signs of softening. Unemployment remains low but is on the rise, job openings have declined by a third from their peak, and fewer workers are voluntarily quitting their jobs. Last week's jobless claims hit their highest level since September 2023, indicating potential stress in the labor market. These factors contribute to a cautious outlook for consumer spending.
Retail sales data for May provided additional insights into consumer behavior. Growth was positive but slower than expected, with headline sales rising 0.1% from the prior month, below the consensus for a 0.3% increase. April's data was also revised lower. Control-group sales, which exclude volatile categories like gas and vehicles, rebounded by 0.4%, but April's decline was more significant than initially reported. From a year ago, control-group sales are 3.1% higher, slightly below the 20-year average. This suggests that consumption growth is slowing, but it appears to be a normalization rather than a cause for alarm.
As pandemic-accumulated savings dwindle and high interest rates curb borrowing, future consumer spending will likely hinge on real income growth. However, changes in income are not the sole driver of consumption. Rising stock market and housing prices create a wealth effect, encouraging spending even without income increases. Household net worth rose to an all-time high of $160 trillion in the first quarter, driven by equity and real estate appreciation. This wealth effect supports a positive outlook for spending, despite the challenges.
The distribution of wealth, however, remains unequal. The top 10% of households by wealth own 87% of equity holdings and 44% of real estate, while the bottom 50% owns just 1% of equities and 11% of real estate. This disparity means that while some consumers are well-supported, others are struggling with debt in the high-interest-rate environment. Serious delinquency rates for credit cards and auto loans are at their highest level in a decade, indicating increasing pressure on low-income consumers. Nonetheless, mortgage delinquencies remain historically low, providing some stability.
In the stock market, the relative performance of the equal-weight S&P 500 consumer discretionary index versus the consumer staples index sends a positive signal about consumer health. Despite the challenges, there are indicators of resilience and potential for continued consumer spending. Important economic releases this week, including PCE inflation data and consumer confidence readings, will provide further insights into the evolving economic landscape.
In conclusion, while the U.S. consumer has shown remarkable resilience, the landscape is shifting. High inflation, rising interest rates, and a softening labor market are creating headwinds. However, the wealth effect from rising asset values and recent wage growth provide some support. As the economy navigates these changes, monitoring consumer sentiment and spending patterns will be crucial for understanding future economic and market dynamics.
AI stock picks for the week (Large Cap S&P 500)
- GILD
- BMY
- XRAY
- SLB (Covered on Tuesday)
- ETSY
(Based on a three month forward looking window)


Comments ()