
The Monday Charge: June 17, 2024
he latest data on U.S. inflation has provided a welcome reprieve for both policymakers and investors. The Consumer Price Index (CPI) and Producer Price Index (PPI) readings for May came in lower than anticipated...

This is our Monday article, focusing on the large cap S&P 500 index. Just the information you need to start your investing week. As always, 100% generated by AI and Data Science, informed, objective, unbiased, and data-driven.
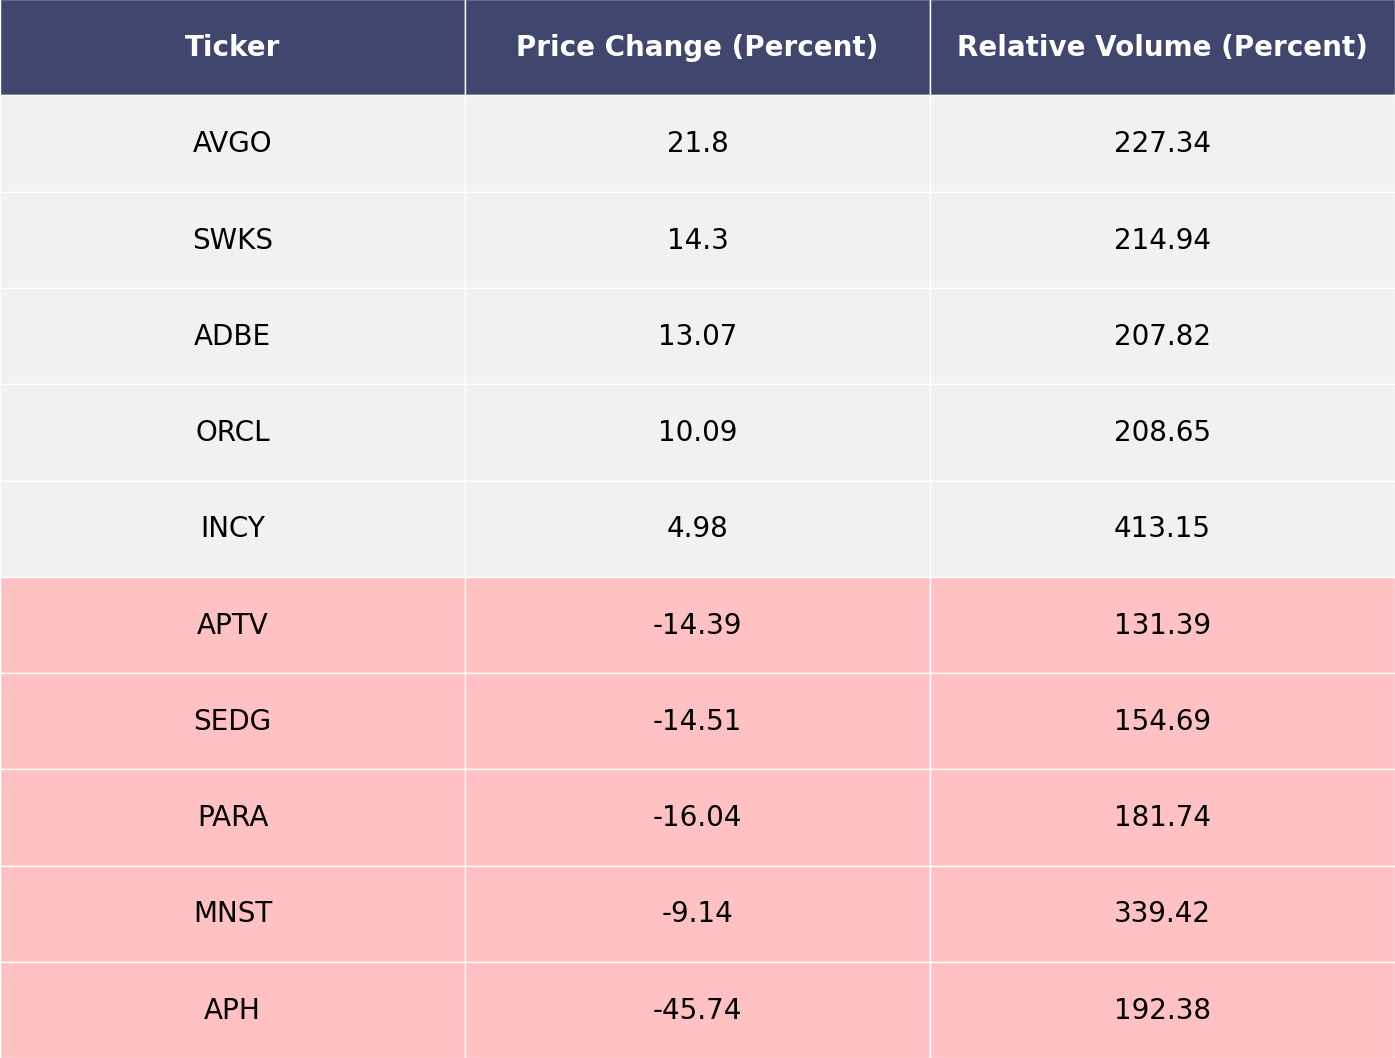
The biggest movers last week on price and volume (Large Cap S&P 500)
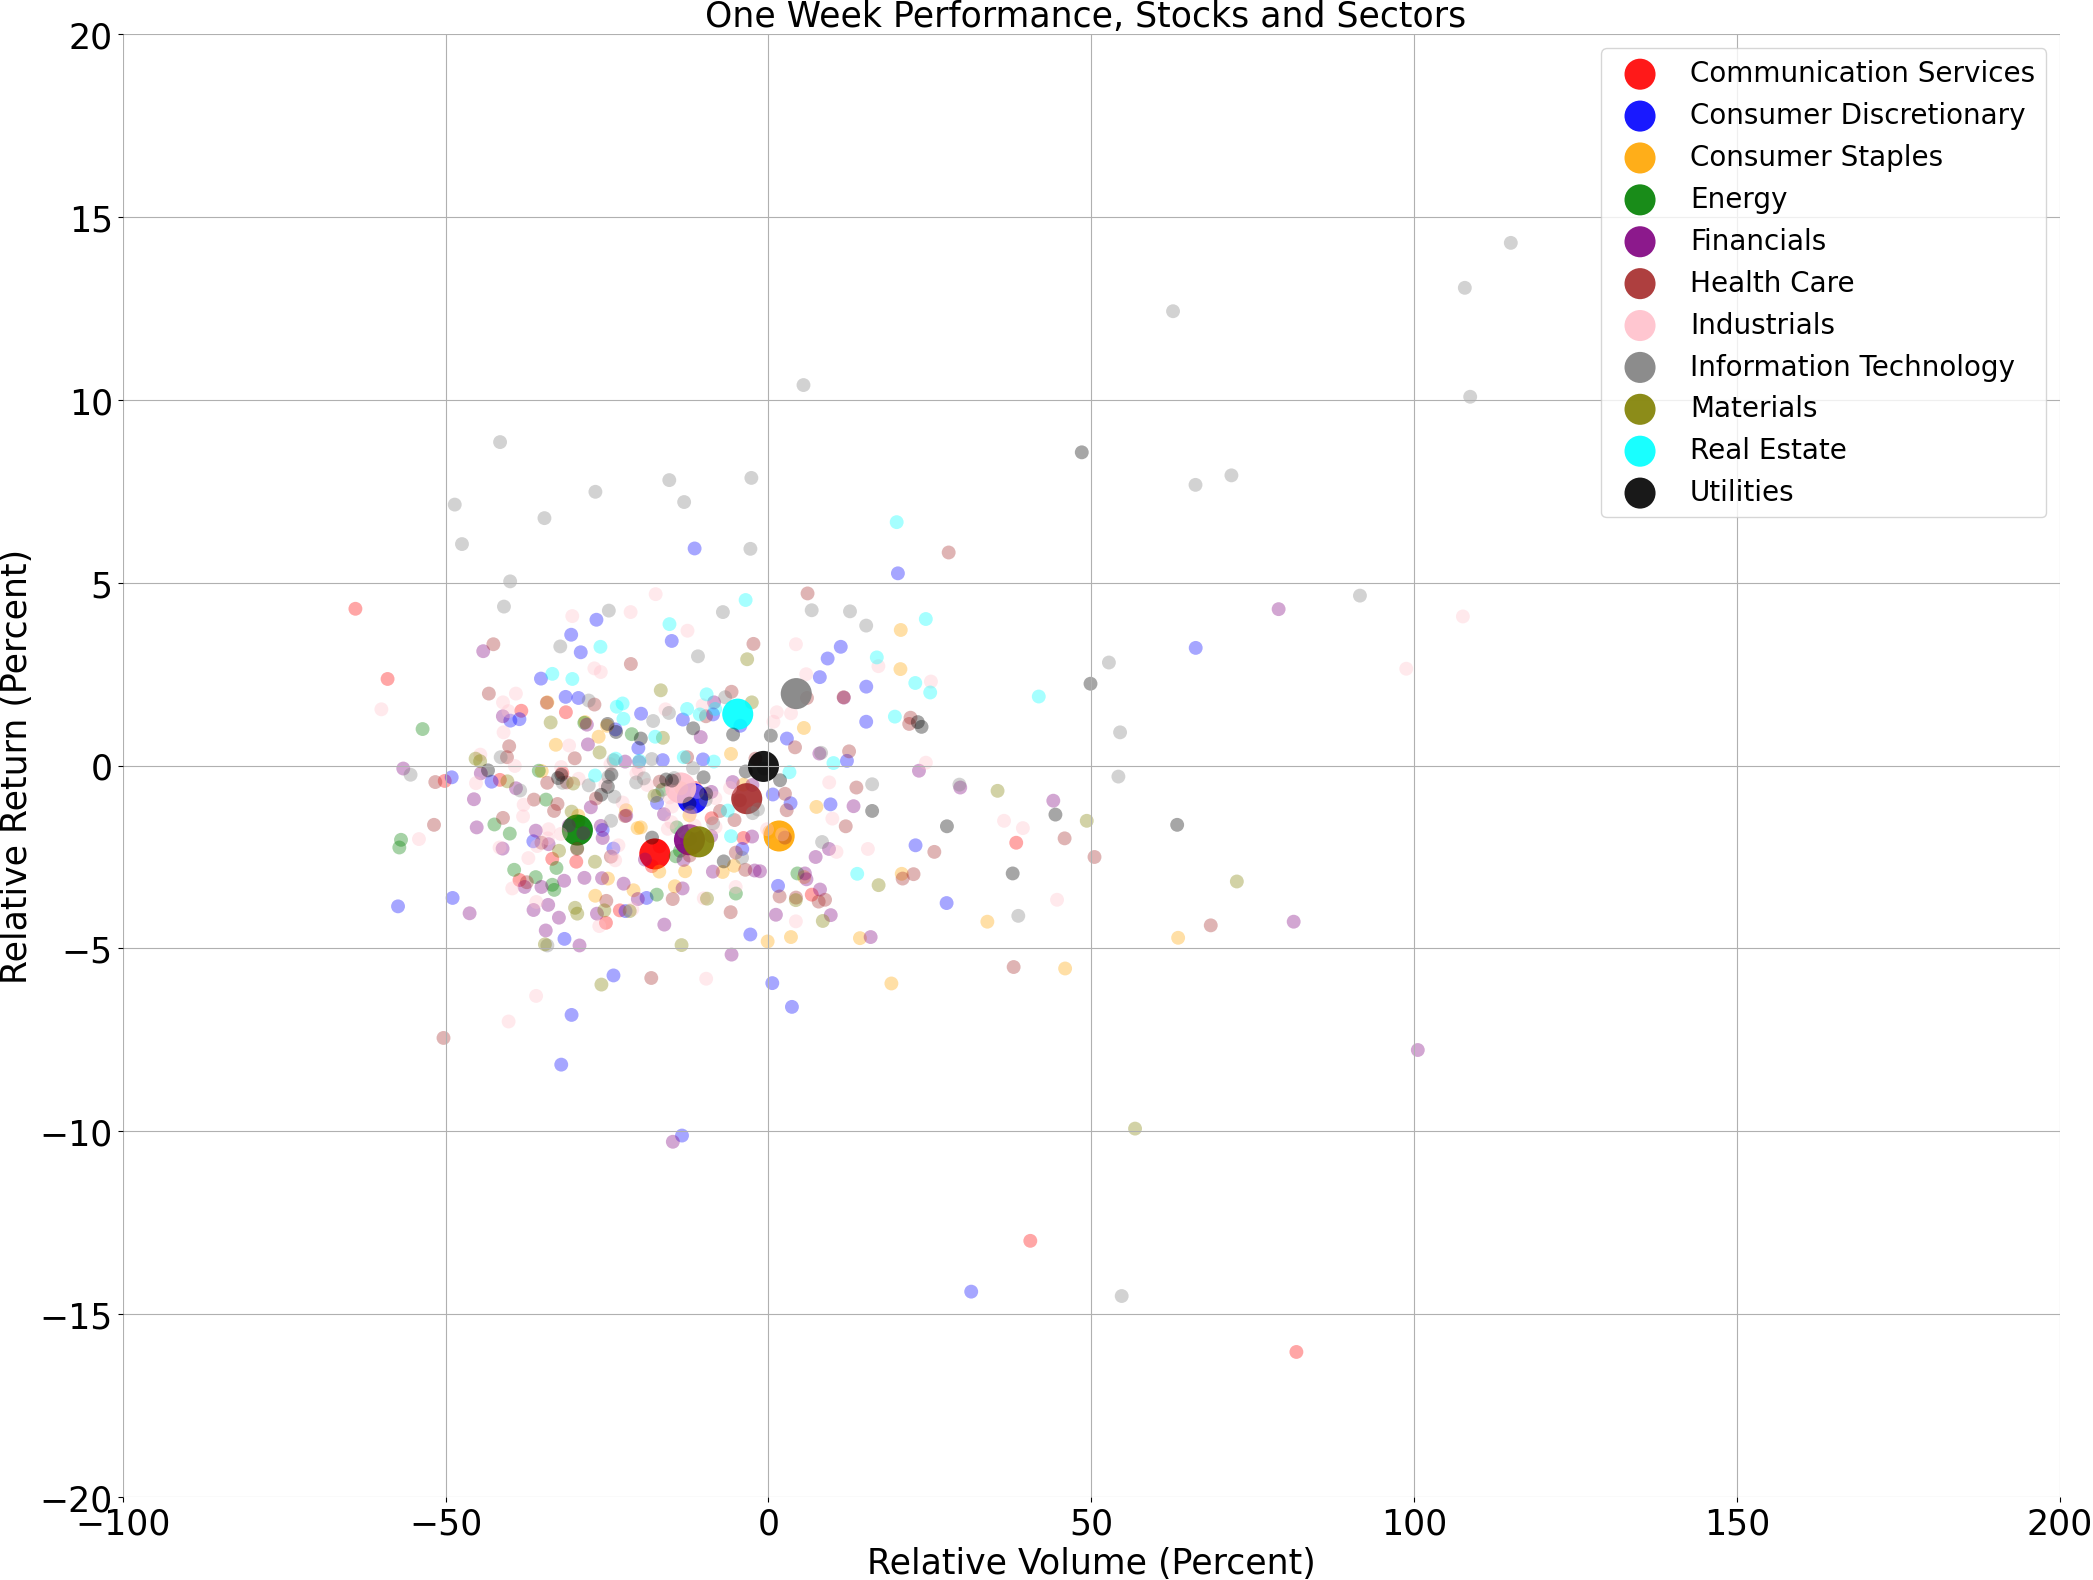
Price and volume moves last week for every stock and sector (Large Cap S&P 500)
A technical analysis across indices
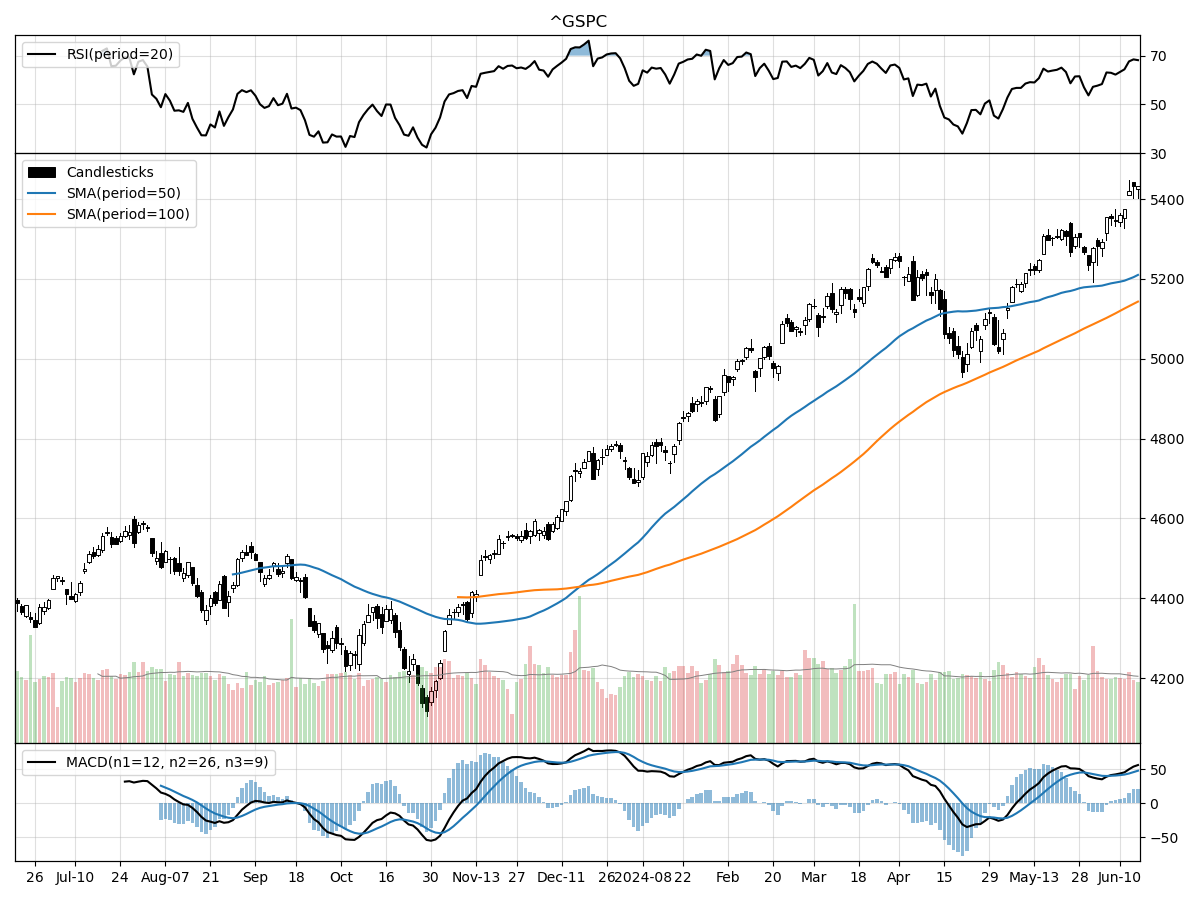
S&P500
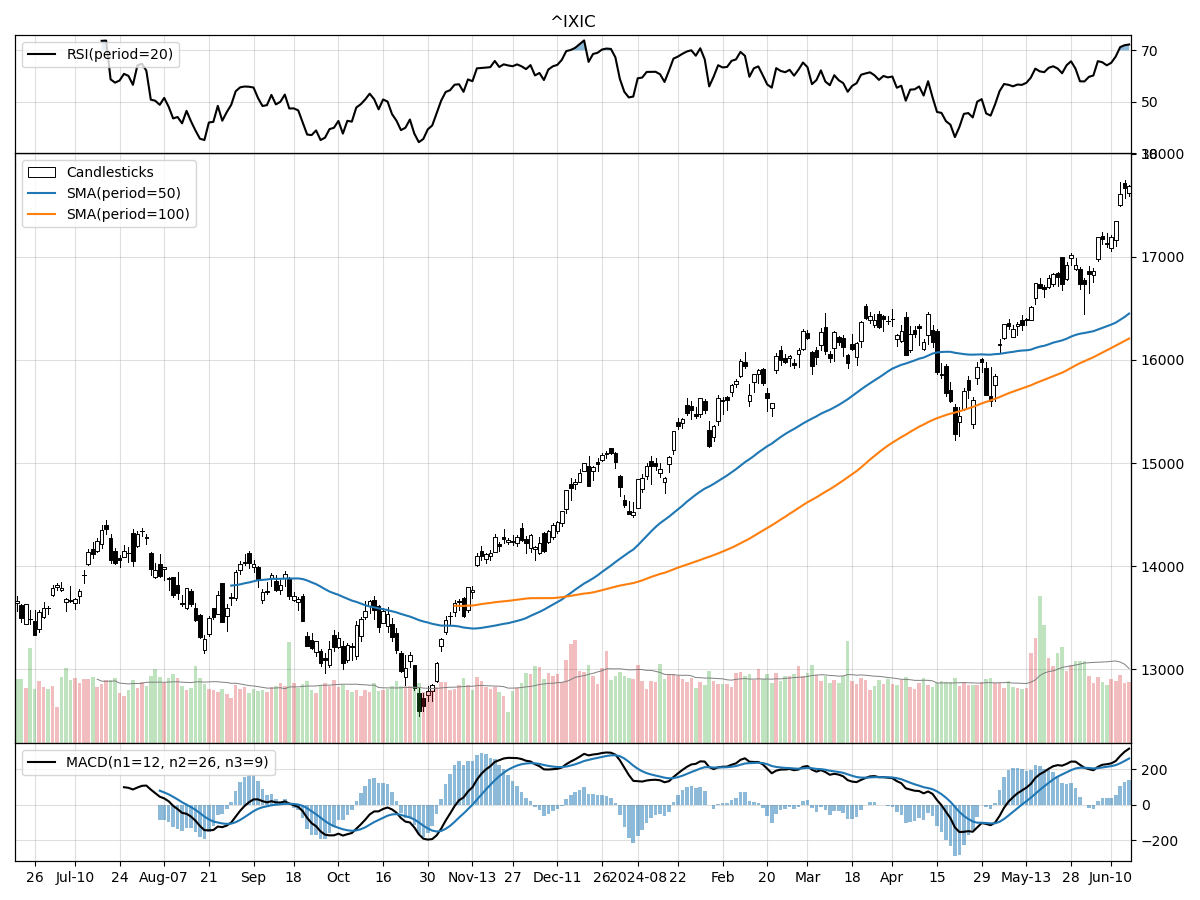
Nasdaq
Russell 2000
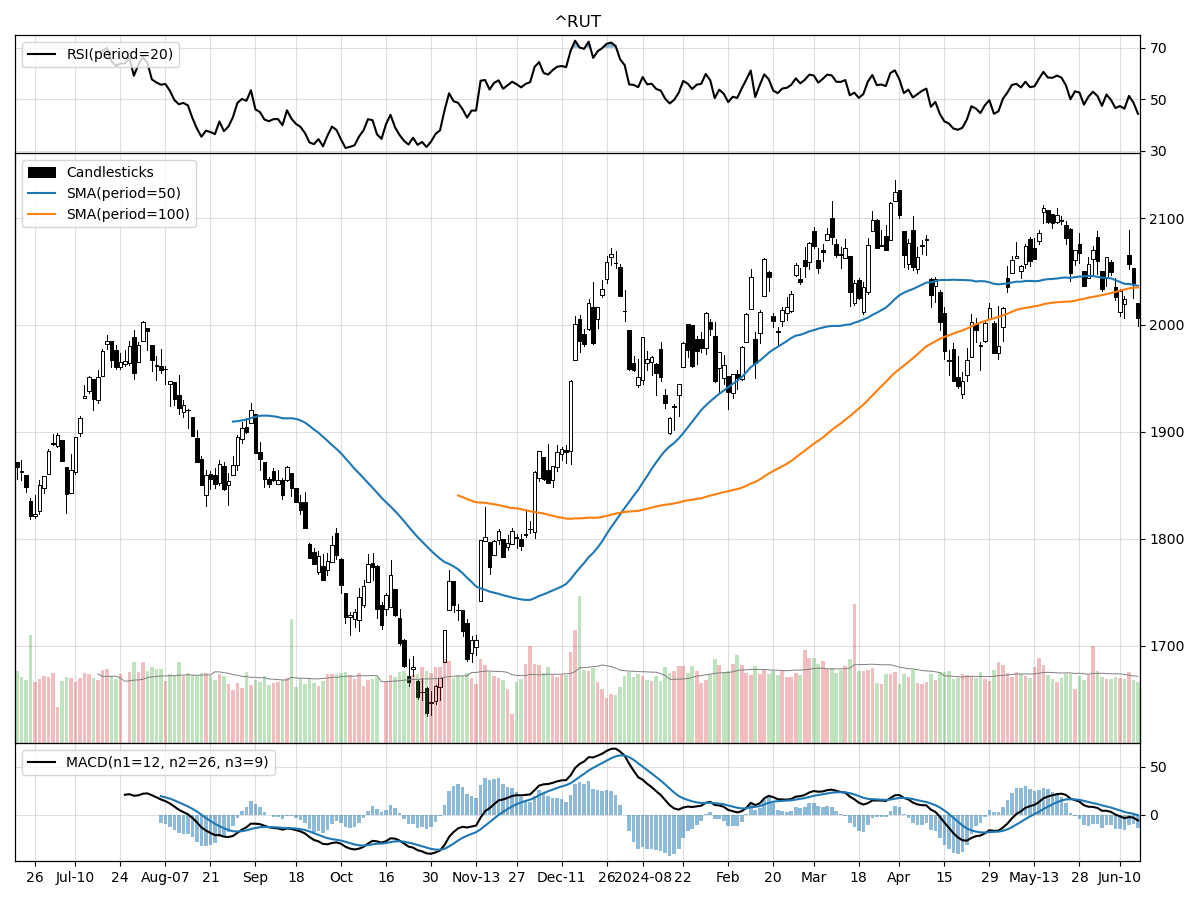
When examining the technical performance of the S&P 500, Nasdaq, and Russell 2000 indices, several distinct trends emerge. The S&P 500 is currently trading at 5431.60, which is 31% above its 52-week low and at its 52-week high. The index has remained relatively stable over the last month and three months, indicating a period of consolidation. Money flow indicators suggest heavy buying pressure and accumulation, supported by a bullish MACD at 48.04. However, the RSI indicates the S&P 500 is overbought, suggesting caution for potential investors as the market could be due for a correction.
In contrast, the Nasdaq index shows more pronounced upward momentum, currently trading at 17688.88. It is 40% above its 52-week low and also at its 52-week high, reflecting substantial gains. Over the past month and three months, the Nasdaq has risen by 6.01% and 7.85%, respectively. Similar to the S&P 500, the Nasdaq is under moderate buying pressure and accumulation with a bullish MACD at 259.8. The RSI also indicates an overbought condition, hinting that the recent rally could face some resistance.
The Russell 2000 paints a different picture, trading at 2006.16, which is 22% above its 52-week low but 5% below its 52-week high. The index has remained stable over the last month and three months, showing neither significant gains nor losses. Money flow indicators point to moderate selling pressure and distribution, with a bearish MACD at -0.65. This suggests that small-cap stocks may be facing more headwinds compared to their larger counterparts in the S&P 500 and Nasdaq indices.
In summary, while the S&P 500 and Nasdaq exhibit strong bullish trends and are under buying pressure, the Russell 2000 shows signs of stagnation and moderate selling pressure. The overbought conditions in the S&P 500 and Nasdaq suggest caution, whereas the Russell 2000's bearish indicators might provide a more cautious outlook for small-cap stocks.
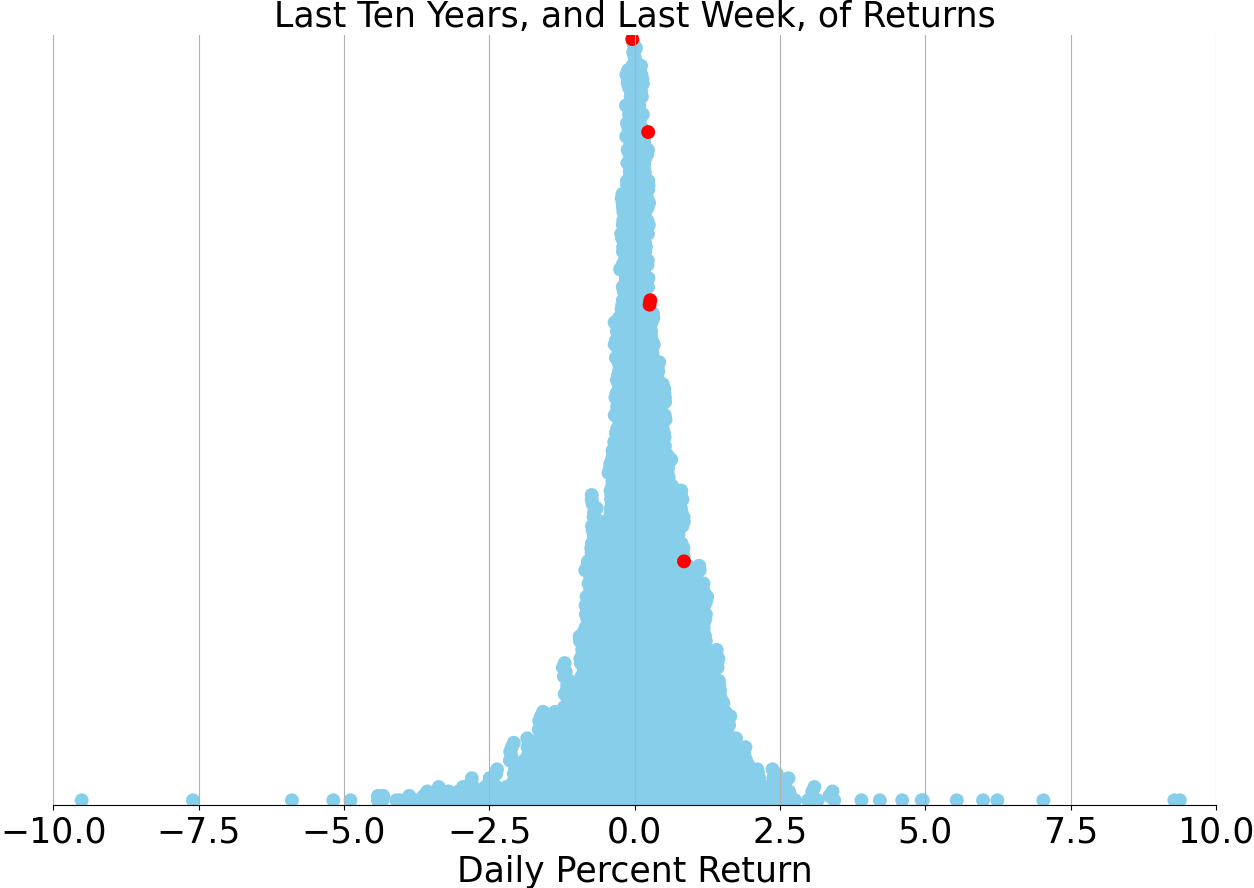
Last week vs. history (Large Cap S&P 500)
Market Commentary
Market Signals Point to a Softer Inflation and Economic Resilience
The latest data on U.S. inflation has provided a welcome reprieve for both policymakers and investors. The Consumer Price Index (CPI) and Producer Price Index (PPI) readings for May came in lower than anticipated, signaling that inflationary pressures may be easing. Year-over-year, the headline CPI inflation rate stood at 3.3%, down from the previous month's 3.4% and below market expectations. Core inflation, which excludes the volatile food and energy sectors, also showed signs of moderation, coming in at 3.4%, compared to forecasts of 3.5% and last month's 3.6%. This cooling of inflation could be a sign that the Federal Reserve's aggressive rate hikes are beginning to take effect.
Federal Reserve Chair Jerome Powell has highlighted key factors that could drive inflation lower in the coming months. Among these are the moderation in shelter and rent costs, which are significant components of the CPI basket. Real-time data already indicates a slowdown in these areas. Additionally, services inflation may ease as the labor market cools and wage growth slows. While a straight-line decline in inflation is unlikely, these trends suggest a continued path of disinflation, potentially giving the Fed more leeway to consider rate cuts in the future.
The Federal Reserve's updated "dot plot," which outlines the views of FOMC members on future interest rates, was keenly anticipated by the markets. While the March dot plot had indicated three rate cuts in 2024, the latest update suggests only one rate cut for this year. Despite this seemingly hawkish stance, the Fed's long-term projections remain unchanged, with a terminal rate of 3.1% by 2026. This suggests that while the Fed may be cautious about the pace of rate cuts, it still aims to gradually lower interest rates to a more neutral level over the next few years.
From an economic standpoint, this gradual reduction in interest rates could lead to better borrowing costs for both households and businesses. Lower rates are historically supportive of higher valuations in the stock market and tend to benefit cyclical sectors. As we move closer to potential Fed rate cuts, market leadership may broaden beyond mega-cap technology stocks. This shift could herald a more sustainable rally in the broader market.
The Fed's updated economic projections paint a relatively optimistic picture for the U.S. economy. The central bank expects GDP growth to remain at or above 2.0% through 2026, with the unemployment rate stabilizing between 4.0% and 4.2%. Despite months of restrictive monetary policy, the Fed does not foresee any significant deterioration in economic activity or the labor market. Moreover, it still believes inflation will fall to its 2.0% target by 2026, even as economic growth remains steady.
This outlook suggests that the U.S. economy is on track for a "soft landing," where growth moderates without tipping into recession. Recent productivity gains, possibly driven by labor shortages and advancements in artificial intelligence, could support this scenario. While consumption and the labor market may cool, this could be seen as a normalization rather than a downturn. If inflation continues to moderate and the Fed begins cutting rates, it could spur further economic momentum in the coming years.
However, risks to this optimistic outlook remain. There is always the possibility that inflation could reaccelerate or that the economy could weaken more than anticipated. Currently, data and leading economic indicators do not support these adverse scenarios. Consumption patterns remain healthy, the labor market is relatively strong, and recent inflation data has been better than expected.
In light of these developments, the Federal Reserve's cautious approach to its 2024 economic and policy outlook seems prudent. If inflation continues to ease or if the labor market cools more than expected, the Fed may consider additional rate cuts in 2024 and beyond. The central bank's forecast for core PCE inflation to reach 2.8% in 2024 aligns with current levels, suggesting that inflationary pressures are indeed moderating.
For investors, the prospect of a terminal fed funds rate in the 3.0% to 3.5% range offers a more stable environment for both bonds and equities. Although Treasury yields may remain elevated compared to recent history, they are expected to settle in a more modest range of 3% to 4%. In this context, bonds continue to offer attractive yields, while U.S. large-cap and mid-cap stocks are well-positioned to perform as the economy normalizes and interest rates gradually decline.
AI stock picks for the week (Large Cap S&P 500)


