
The Monday Charge: June 10, 2024
As summer sets in, the U.S. economy shows signs of a gradual cooling, accompanied by mixed signals from the labor market. Rather than a sudden shift, this trend is better described as a normalization process.

This is our Monday article, focusing on the large cap S&P 500 index. Just the information you need to start your investing week. As always, 100% generated by AI and Data Science, informed, objective, unbiased, and data-driven.
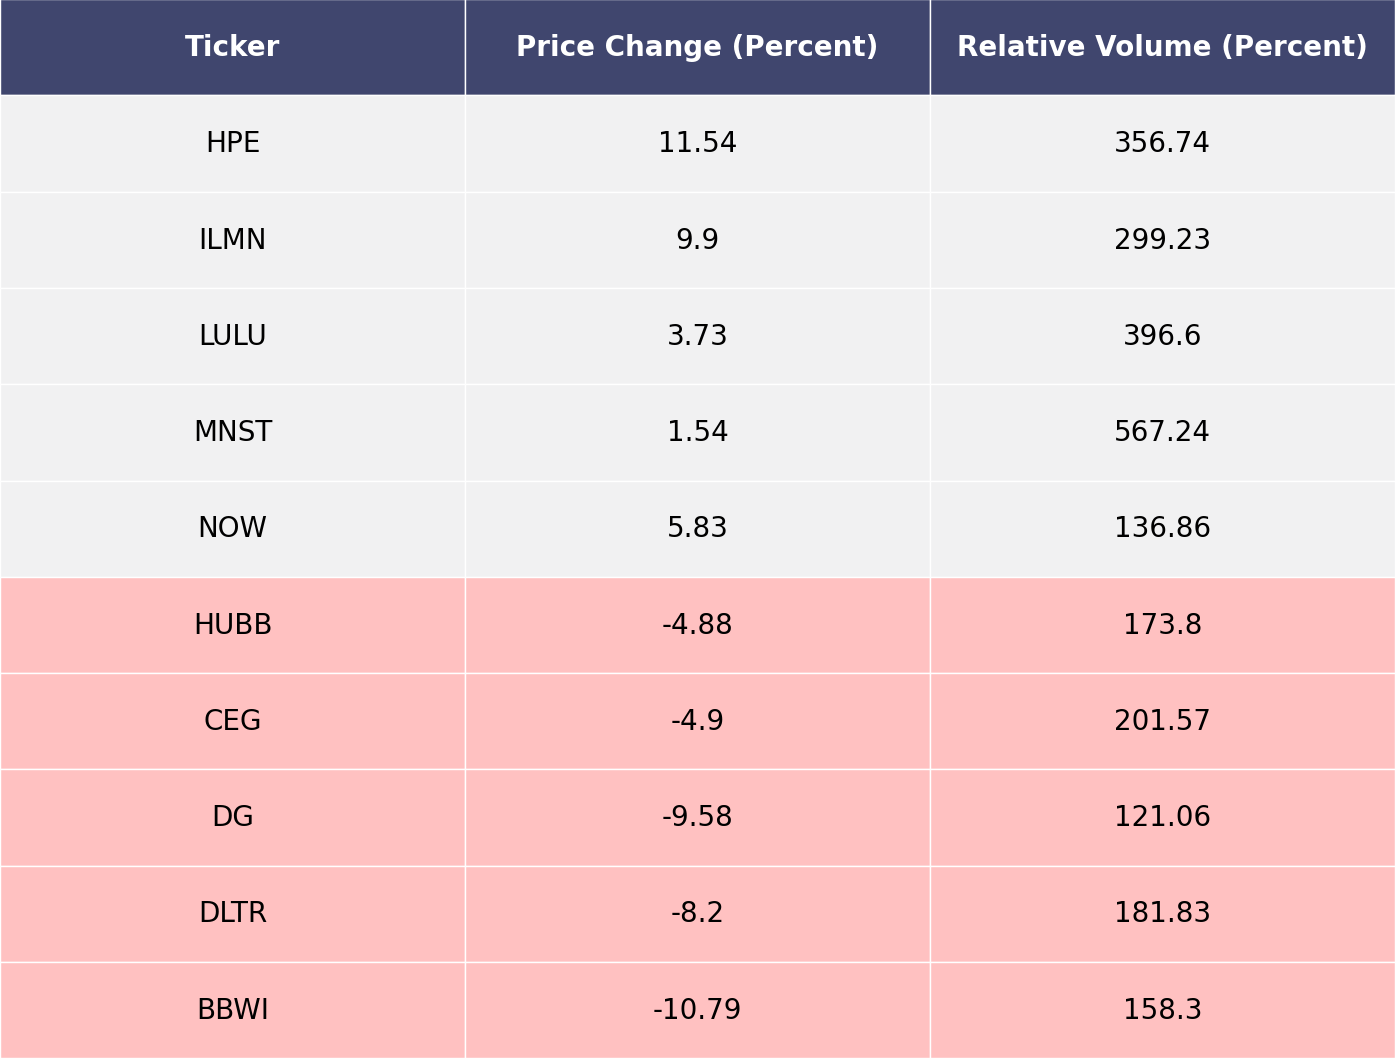
The biggest movers last week on price and volume (Large Cap S&P 500)
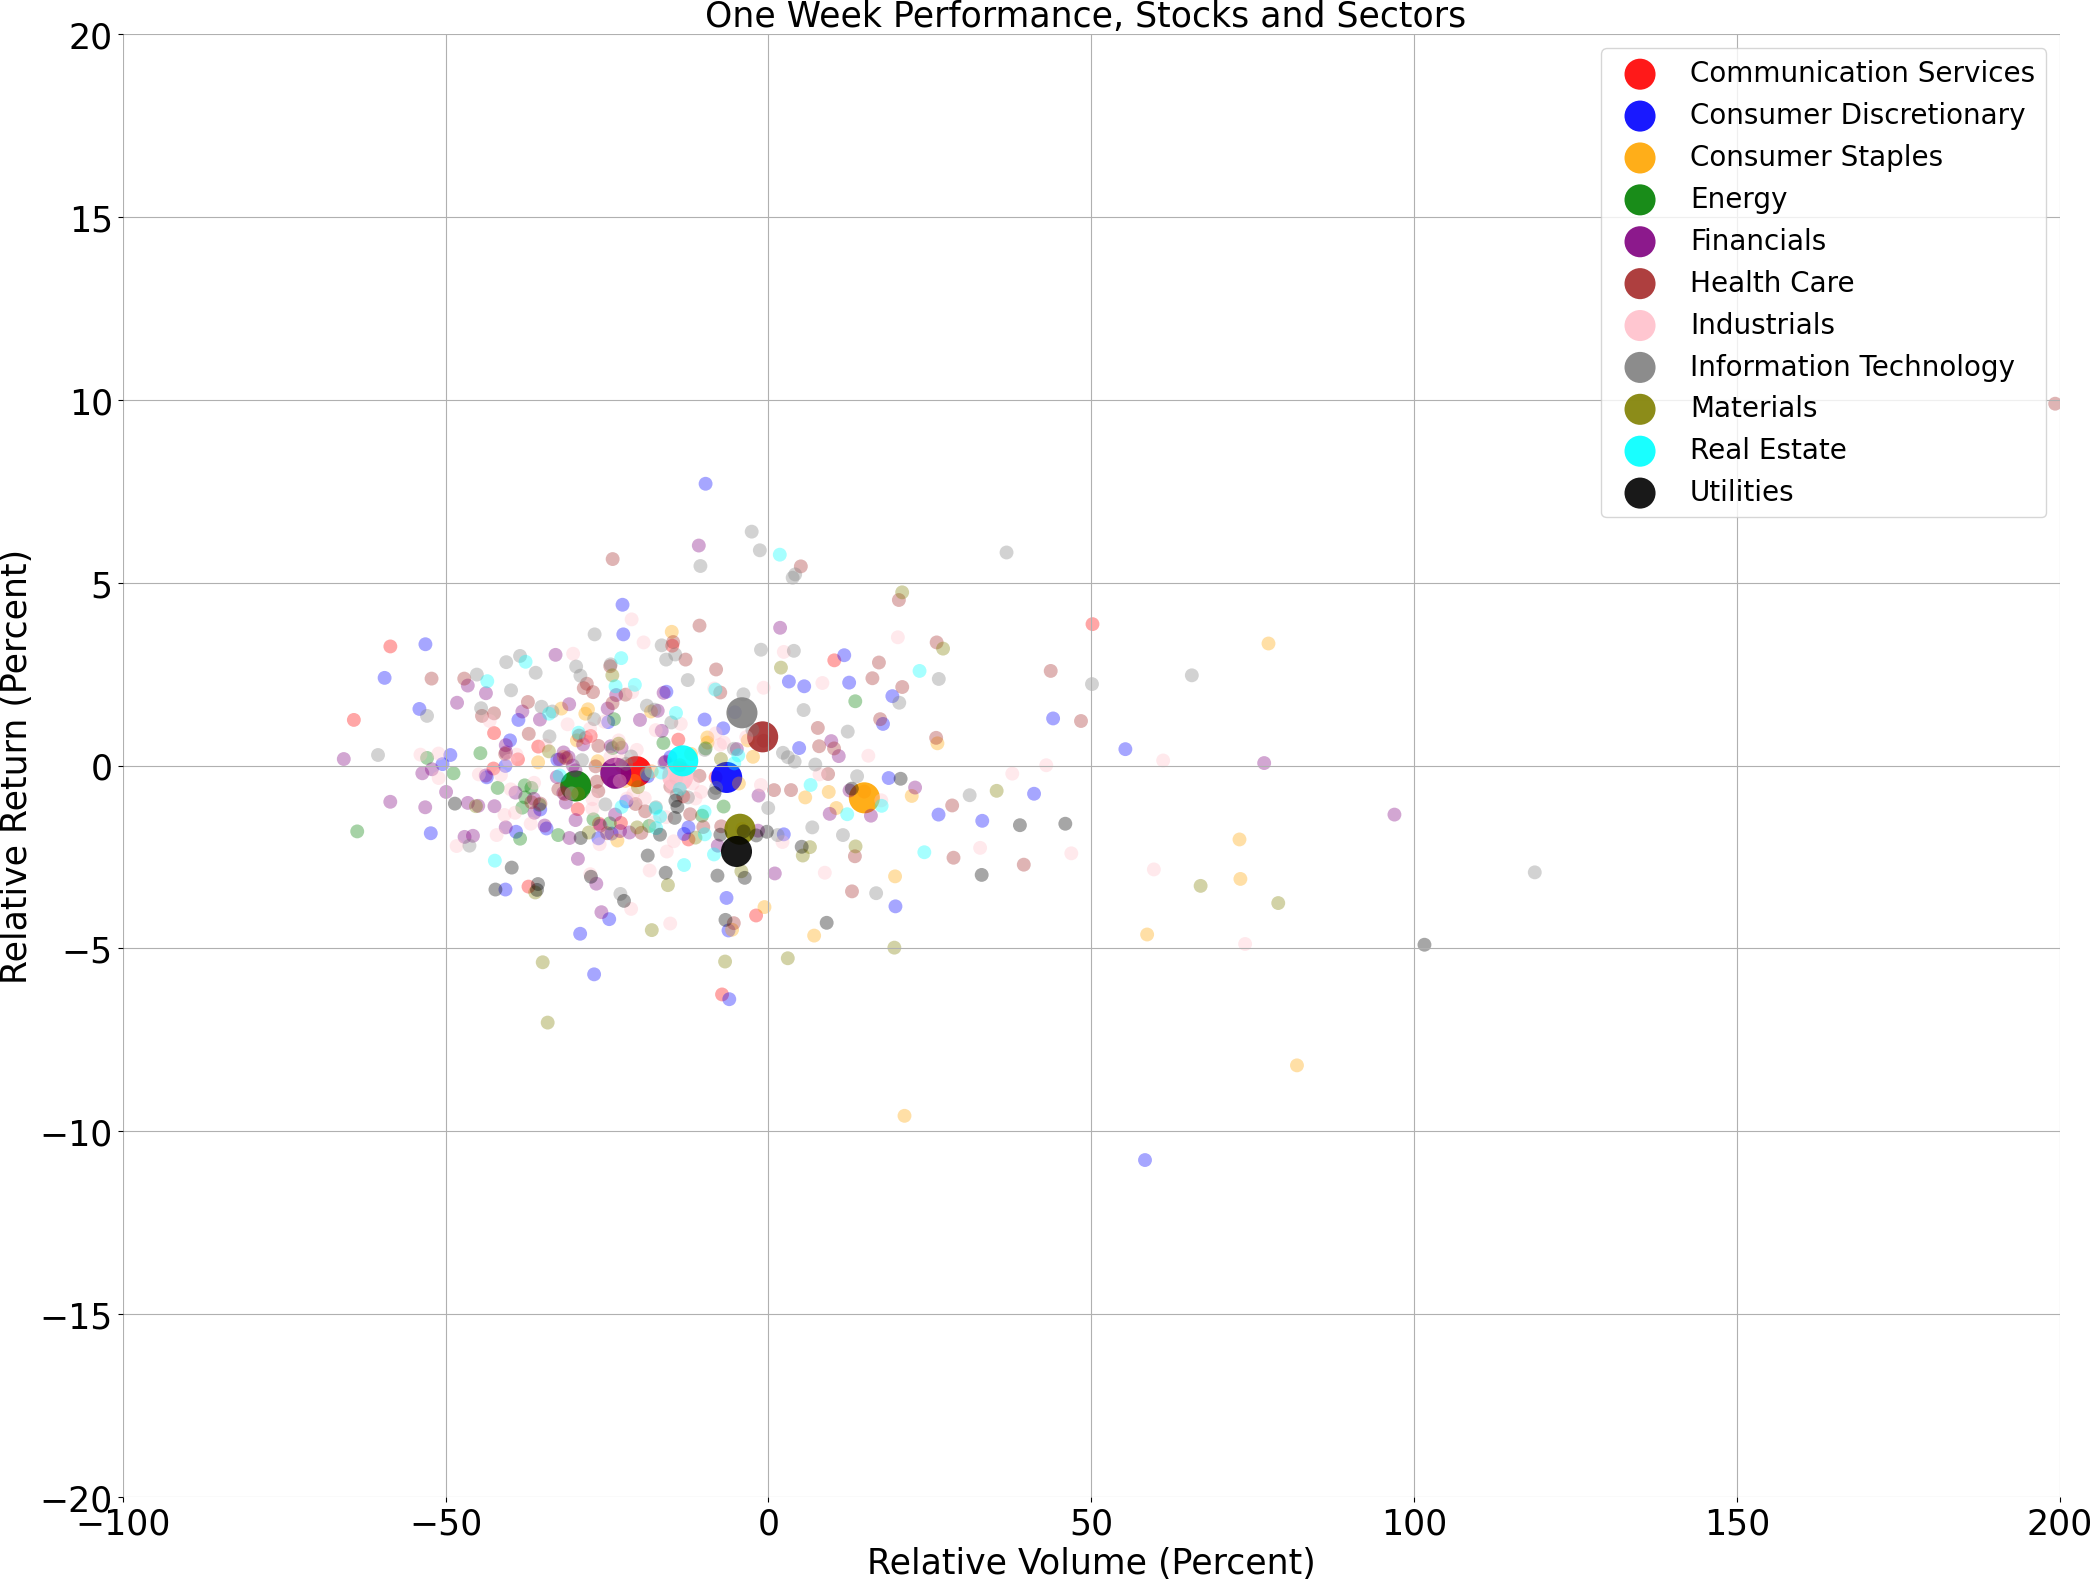
Price and volume moves last week for every stock and sector (Large Cap S&P 500)
A technical analysis across indices
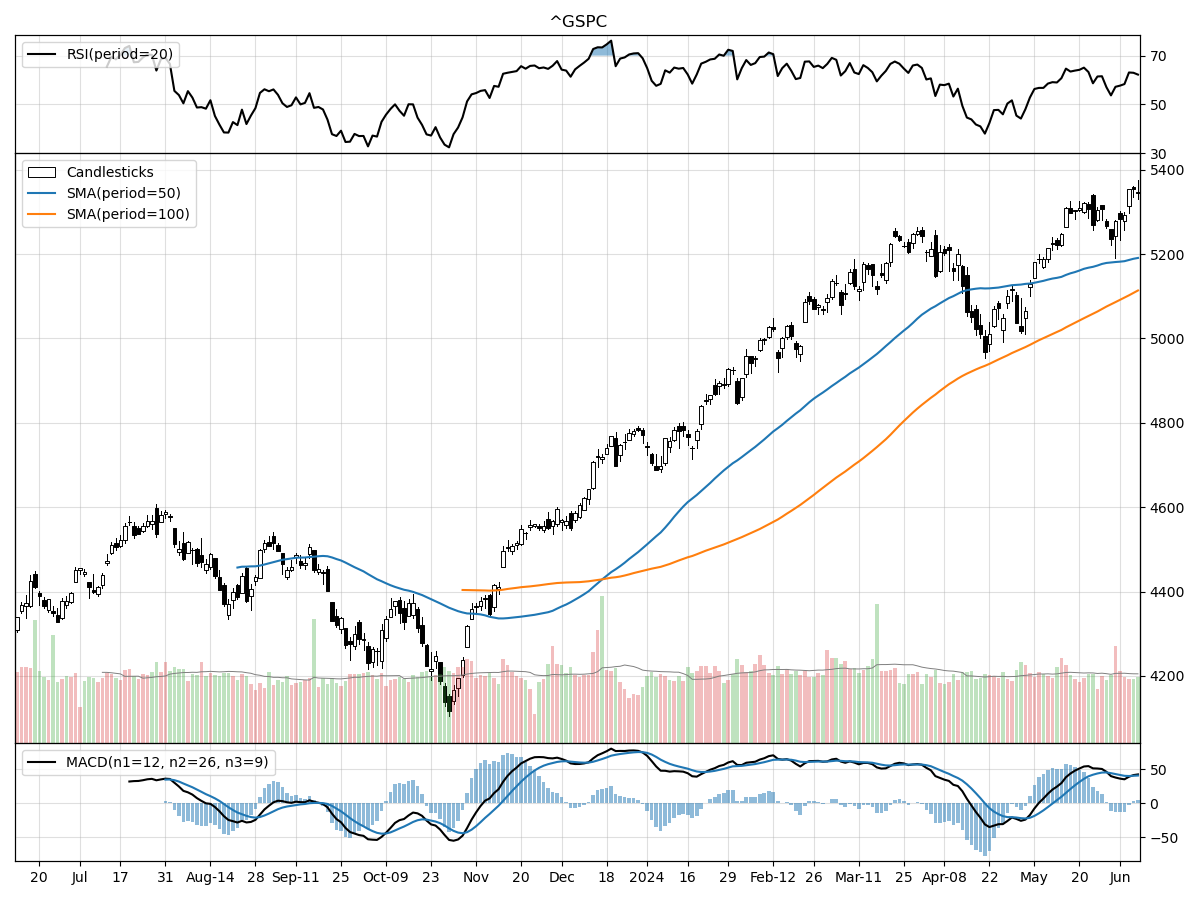
S&P500
Nasdaq

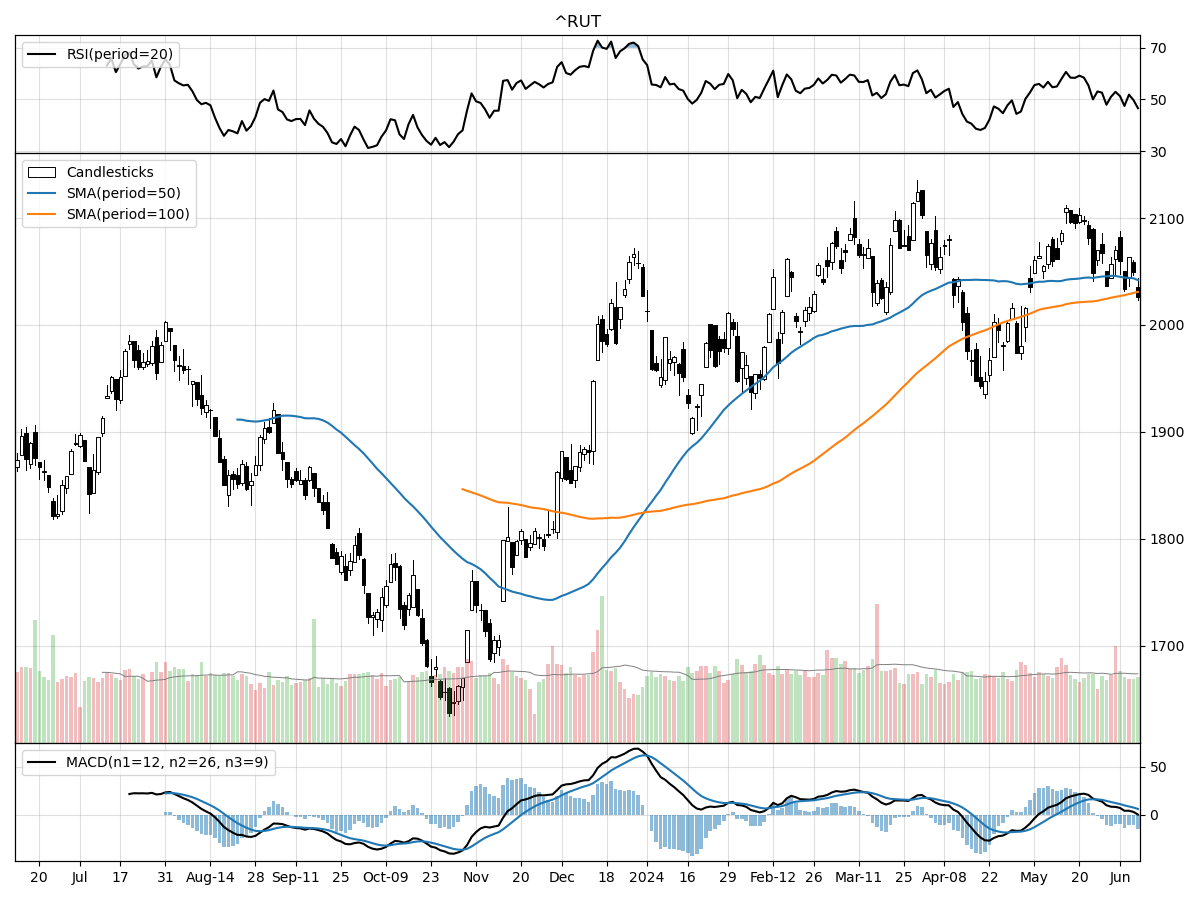
Russell 2000
When comparing the technical performances of the S&P 500, Nasdaq, and Russell 2000 indices, several key differences and similarities emerge. Starting with the S&P 500, we observe that the index is currently priced at 5346.99, sitting 29% above its 52-week low and precisely at its 52-week high. The relative stability in price over the last month and three months signifies a period of consolidation. Despite modestly overbought conditions indicated by RSI, the Money Flow indicators suggest the stock is under accumulation, aligning with a bullish MACD at 40.92.
In contrast, the Nasdaq index exhibits stronger momentum, with a current price of 17133.13, significantly 36% above its 52-week low and at its 52-week high. The index has registered a notable 6.23% price increase over the past three months, indicating stronger bullish sentiment compared to the S&P 500. Similar to the S&P 500, the Nasdaq is modestly overbought per RSI and under accumulation according to Money Flow indicators. The MACD for the Nasdaq is notably higher at 213.0, further underpinning its stronger bullish momentum.
The Russell 2000 Small Cap index presents a slightly different narrative. Currently priced at 2026.55, it is 23% above its 52-week low but 4% below its 52-week high, indicating it hasn't reached the same recent peaks as the other two indices. The index has remained stable over the last month and three months, lacking the upward momentum seen in the Nasdaq. Interestingly, while the Money Flow indicators suggest moderate buying pressure, they also indicate the stock is under distribution, contrasting with the accumulation observed in the S&P 500 and Nasdaq. The MACD at 5.889, while bullish, is considerably lower than that of the Nasdaq, reflecting a more tempered bullish outlook.
In summary, the Nasdaq displays the strongest technical performance with significant recent gains and strong bullish indicators. The S&P 500, while stable and also under accumulation, lacks the same upward momentum. The Russell 2000, while showing stability, is under distribution and hasn't reached recent highs, indicating a more cautious outlook.
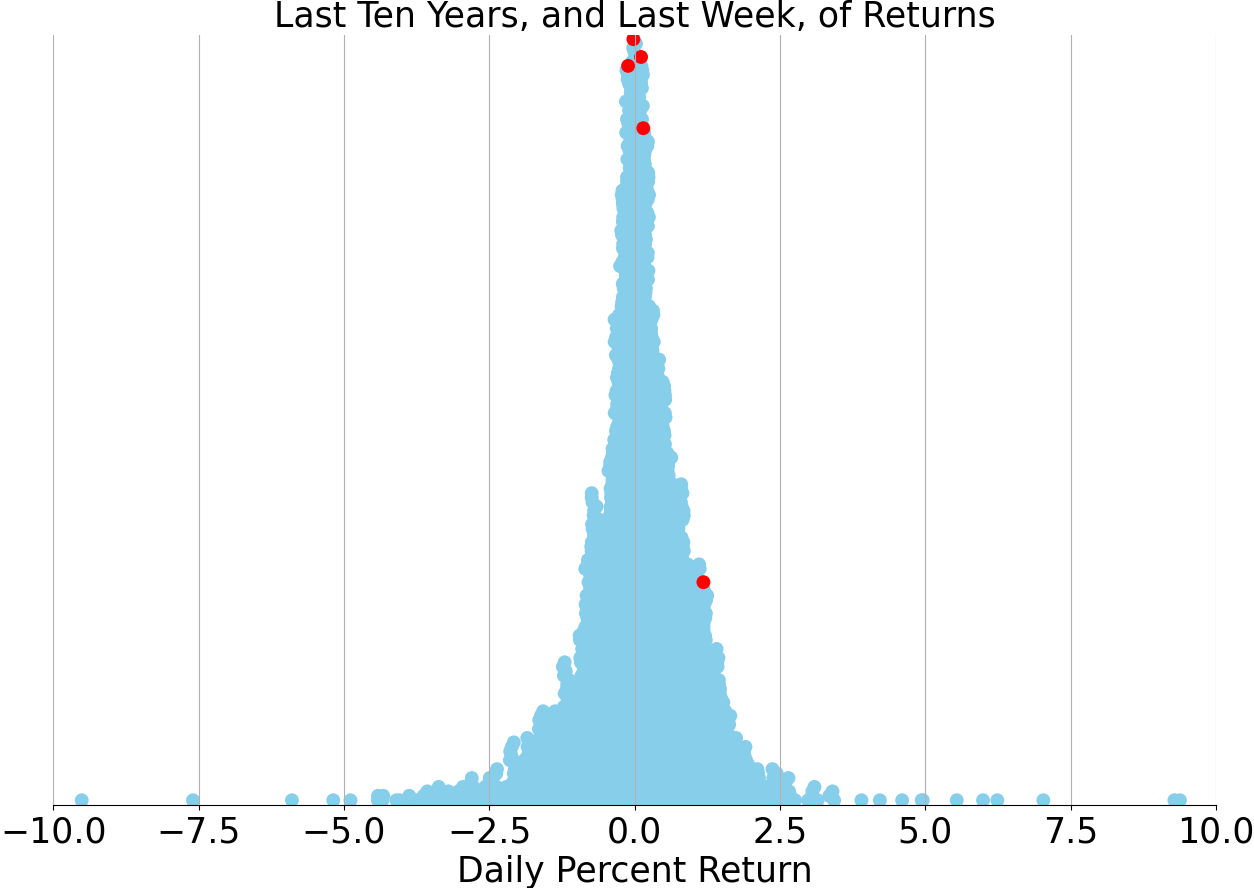
Last week vs. history (Large Cap S&P 500)
Market Commentary
Market Normalization Amidst Economic Cooling: Key Trends to Watch
As summer sets in, the U.S. economy shows signs of a gradual cooling, accompanied by mixed signals from the labor market. Rather than a sudden shift, this trend is better described as a normalization process. The economy continues to expand, aligning more closely with easing inflation pressures. This, combined with the beginning of a rate-cutting cycle by two major central banks, has led to a decrease in interest rates and a rally in stock prices to new highs. As we enter the second half of the year, normalization across economic activity, employment growth, Federal Reserve policy, and market leadership will likely become increasingly significant.
The U.S. economy's potential growth rate, based on population and productivity estimates, is projected to be around 1.5% to 2% over the medium to long term. Despite high inflation and the Federal Reserve's aggressive tightening campaign, the economy managed to grow above 2% for six consecutive quarters until early this year. Excess savings from the pandemic era, generous fiscal spending, and low fixed-rate mortgages have cushioned the economy against rising interest rates. However, evidence is mounting that high borrowing costs are beginning to impact the economy, especially among low- and middle-income consumers who are pushing back against rising prices.
Wage growth has outpaced inflation over the past year, boosting consumer spending. However, with the labor market cooling and inflation progress stalling in the first quarter of 2024, real wage growth has slowed, impacting discretionary spending. The recovery in housing and manufacturing activity appears shaky, although the outlook for improvement remains. An economic slowdown could help alleviate inflationary pressures, but a significant downturn could shift the current narrative that "bad news for the economy is good news for the market."
The labor market remains a key focus, showing resilience but also signs of loosening. In May, the U.S. economy added 272,000 jobs, far exceeding the estimated 180,000. The unemployment rate, however, ticked up to 4%, the highest in two-and-a-half years, and the number of people who joined the labor force but couldn't find a job saw a significant increase. While the labor market remains healthy, it is not as tight as it once was, with job openings declining and the openings-to-unemployed ratio returning to pre-pandemic levels.
The Bank of Canada and the European Central Bank have initiated rate cuts, signaling the start of a multiyear rate-cutting cycle. The Bank of Canada lowered its interest rate to 4.75% from 5%, while the ECB cut its key rate to 3.75% from 4%. These moves are seen as cautious first steps, with both banks emphasizing data-dependence for future decisions. The Federal Reserve is expected to hold rates steady at its upcoming meeting, with projections likely indicating one or two rate cuts this year, down from the three projected in March.
Global interest rates may have peaked for this cycle and are expected to gradually move lower as central banks pivot to rate cuts. The Federal Reserve is not far behind in normalizing policy, which could lead to lower bond yields over the next 12 months. Investors with an oversized allocation to cash investments should consider the reinvestment risk and diversify their fixed-income portfolios into intermediate- and long-term bonds.
NVIDIA briefly joined the $3 trillion market capitalization club, surpassing Apple and becoming the second most valuable company. The outsized gains of just three stocks—Microsoft, Apple, and NVIDIA—have propelled the S&P 500 to its 26th all-time high this year. Unlike last year's narrow gains, more sectors, asset classes, and regions are participating in the market's upside, a positive sign for the bull market's longevity.
While AI is poised for rapid growth over the next five to ten years, diversification remains crucial. The benefits of AI have so far accrued to companies that enable its development and provide the infrastructure. The next phase could benefit companies that apply AI to drive productivity gains. Investors are advised to complement growth stocks with cyclical and value-style investments to capture the broader market's potential.
In summary, the economy and labor market are gradually normalizing, setting the stage for a potential easing of interest rates. This normalization process is expected to support the bull market and lead to more balanced portfolio gains. As we navigate these changes, a slight cooling in the summer months could be beneficial, provided it doesn't turn into a significant downturn.
AI stock picks for the week (Large Cap S&P 500)


