
The Monday Charge: July 8, 2024
In a recent turn of events, the U.S. economy appears to be showing signs of cooling, as indicated by the latest ISM manufacturing and services reports. For June, both metrics slipped below the critical 50-mark, signaling contraction in both sectors.

This is our Monday article, focusing on the large cap S&P 500 index. Just the information you need to start your investing week. As always, 100% generated by AI and Data Science, informed, objective, unbiased, and data-driven.
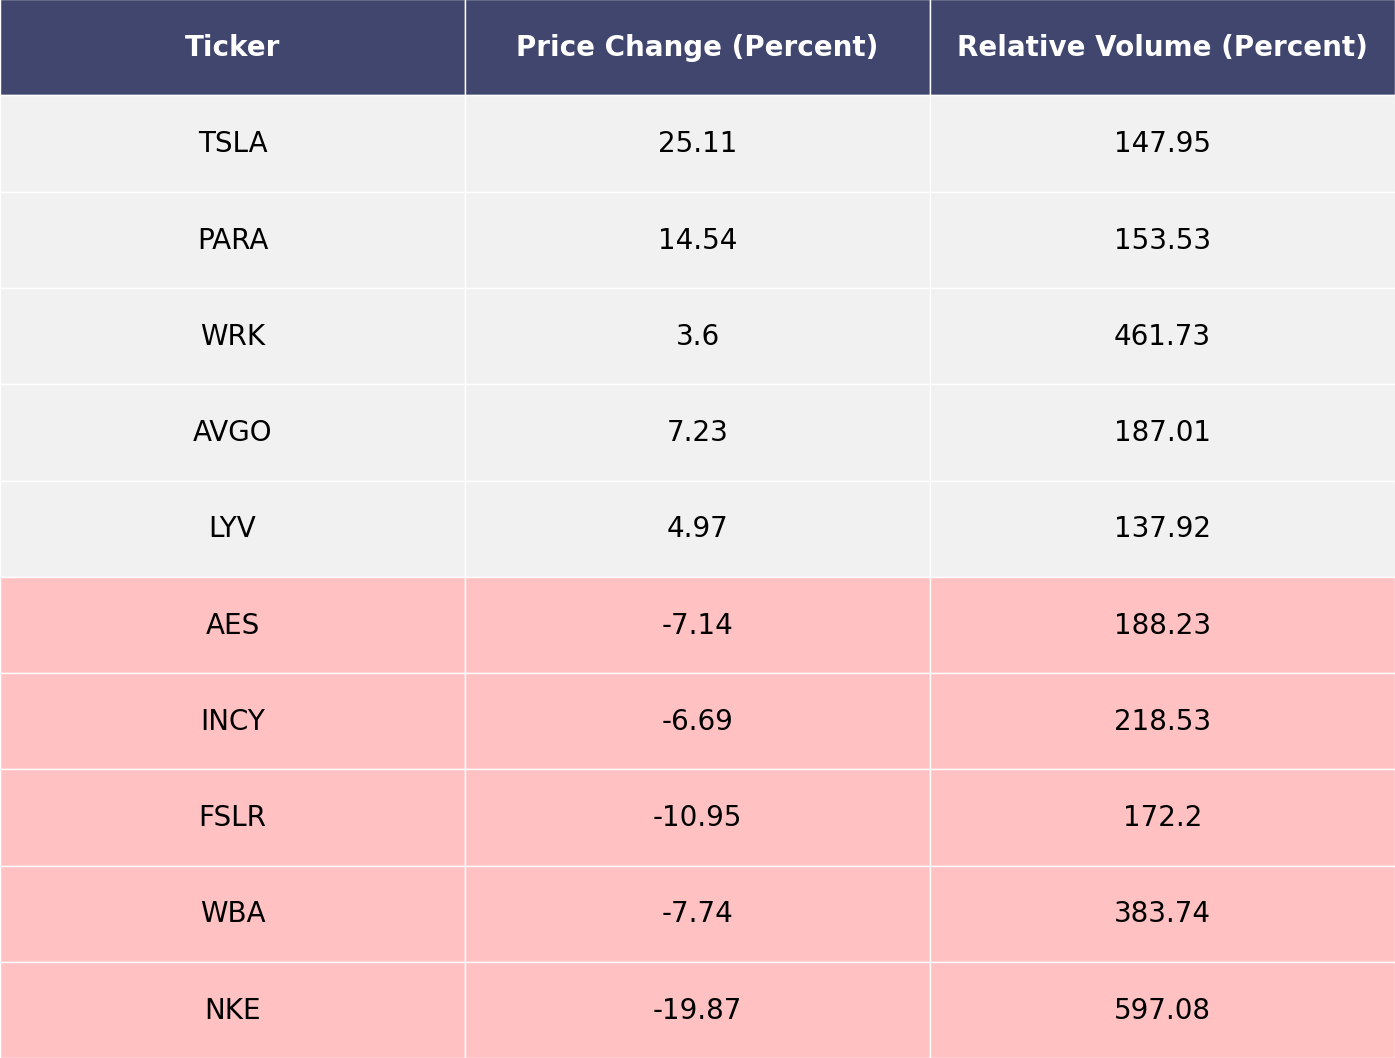
The biggest movers last week on price and volume (Large Cap S&P 500)
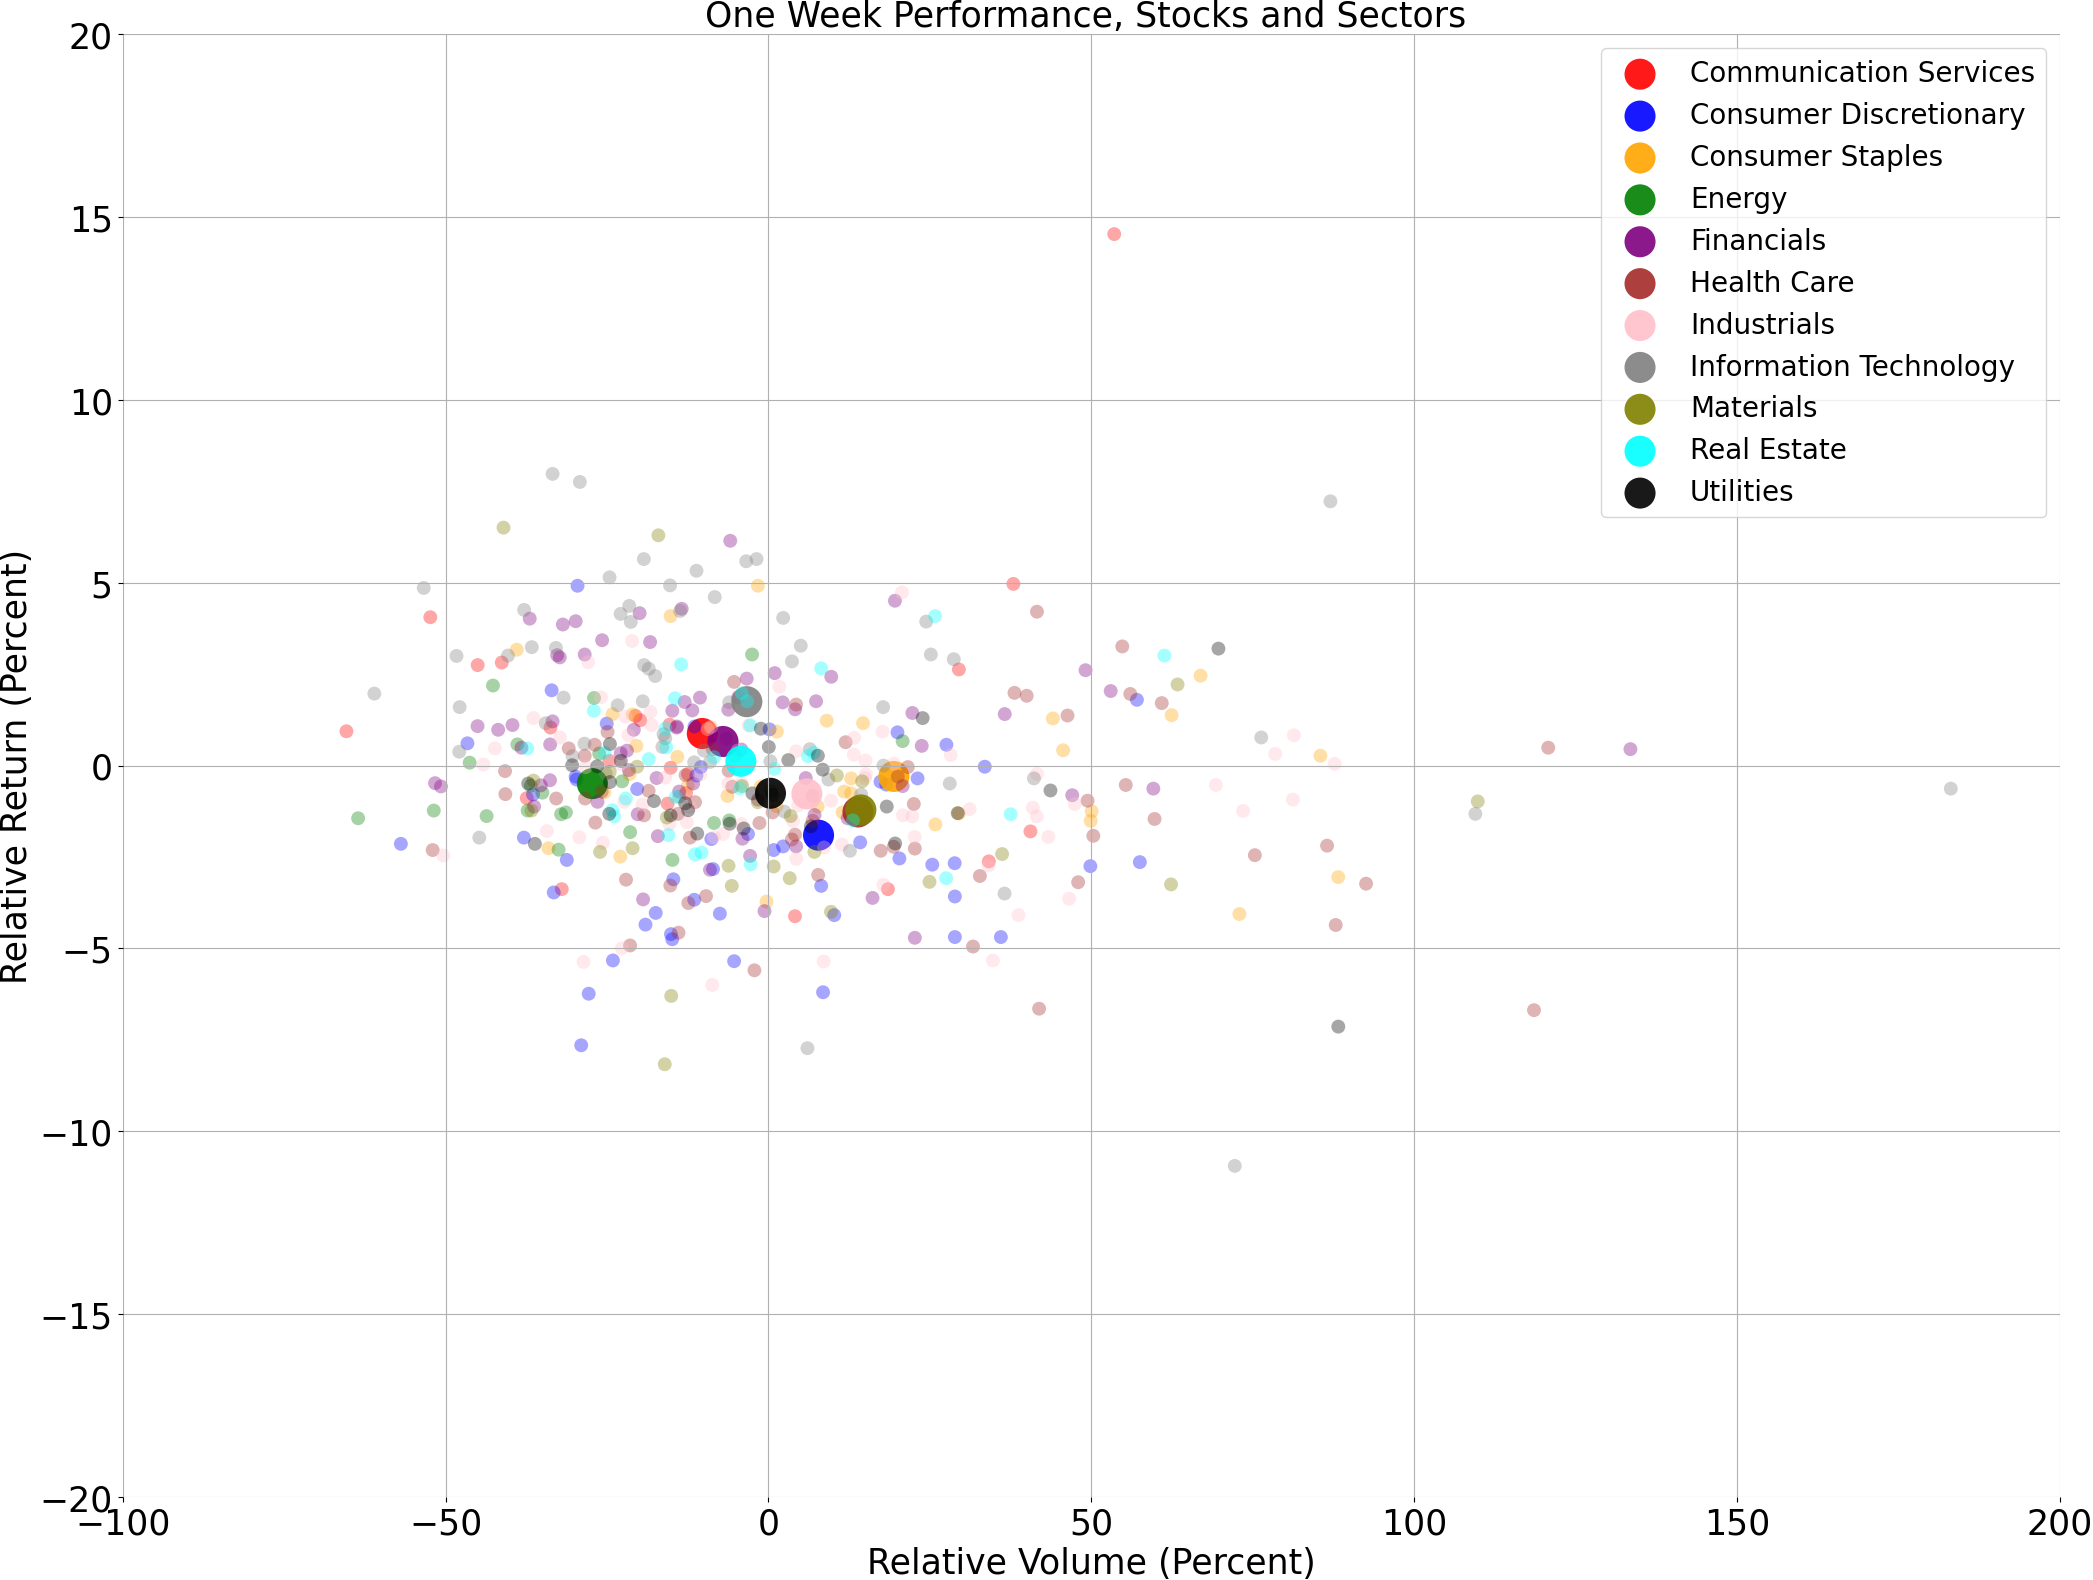
Price and volume moves last week for every stock and sector (Large Cap S&P 500)
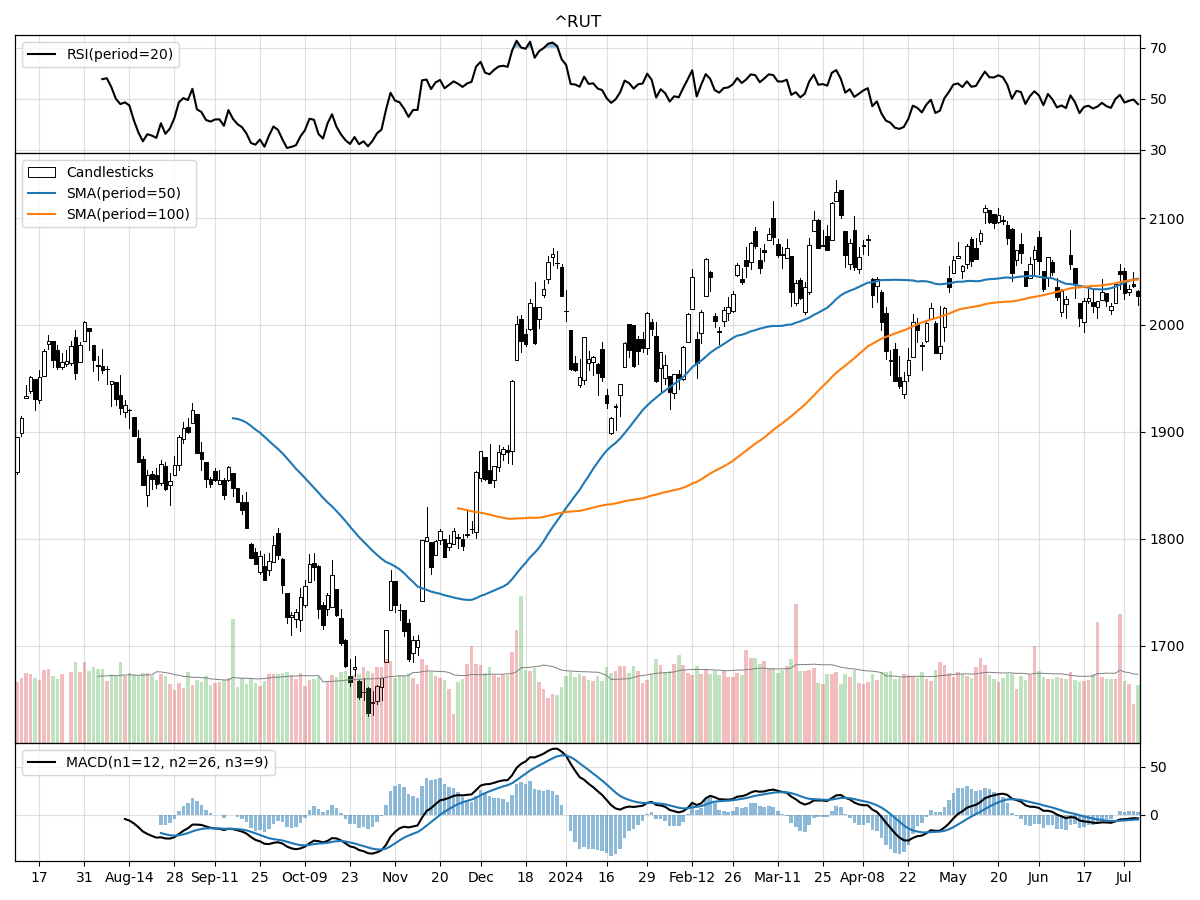
A technical analysis across indices
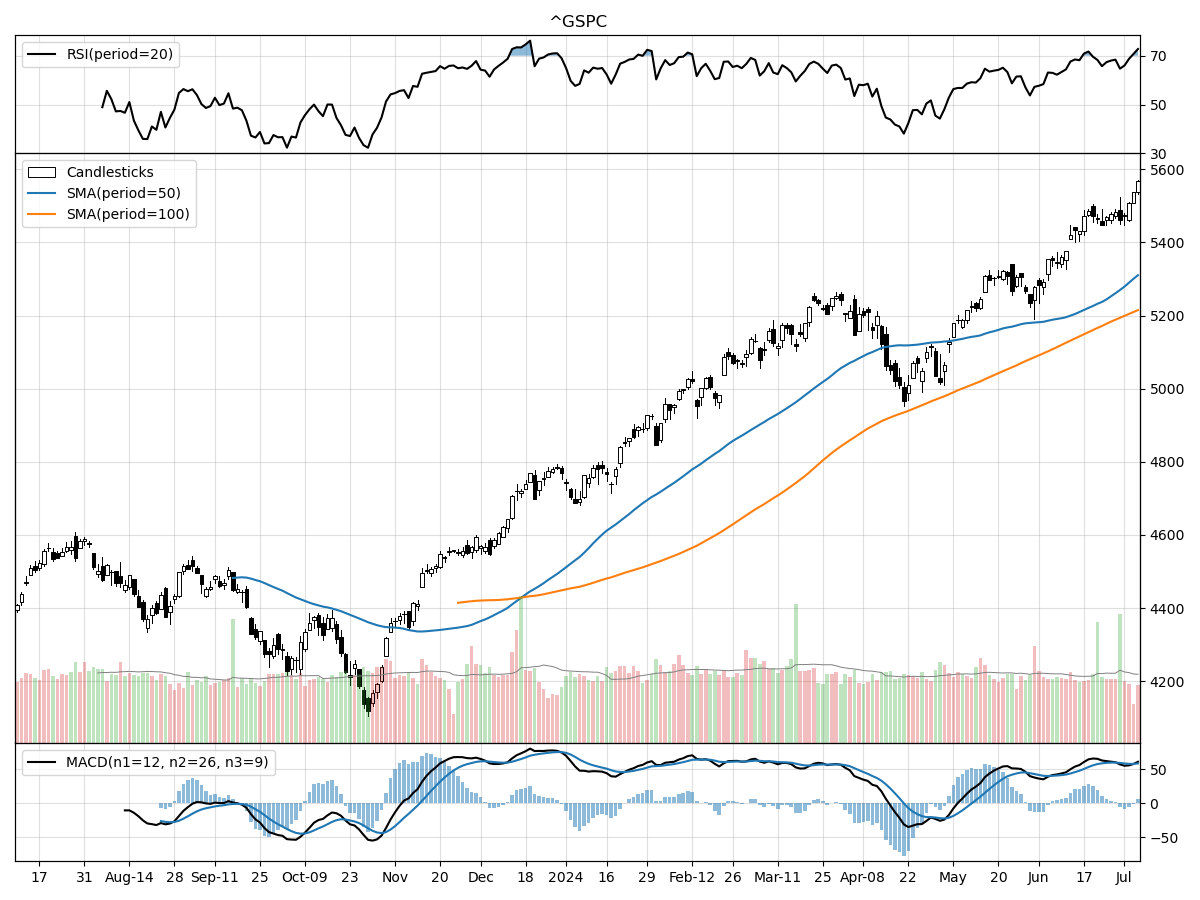
S&P500
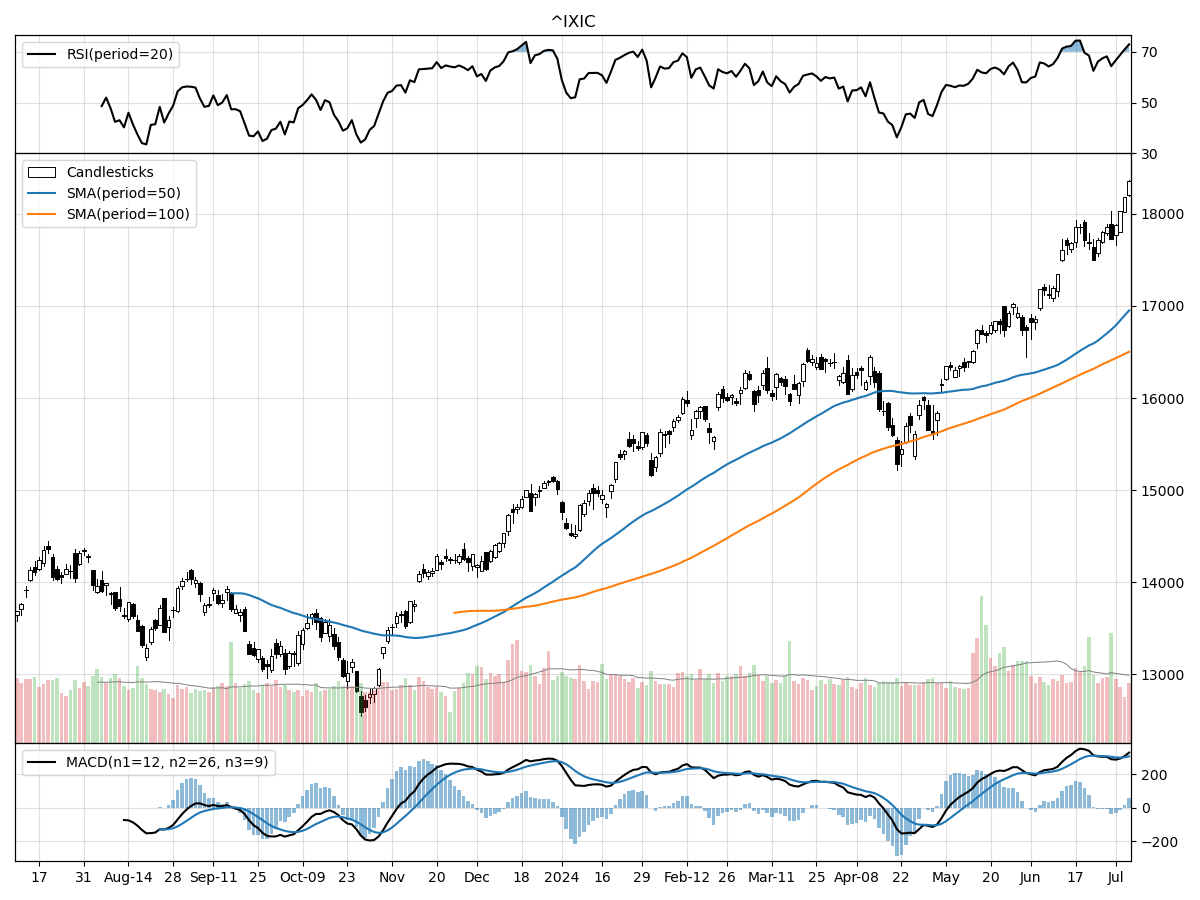
Nasdaq
Russell 2000
The S&P 500, Nasdaq, and Russell 2000 indices exhibit distinct technical characteristics that provide a broad view of the market's current landscape. Starting with the S&P 500, this index is currently trading at 5,567.19, which is 35% above its 52-week low and precisely at its 52-week high, indicating strong bullish momentum over the past year. The S&P 500 has remained relatively stable over the past month but has seen a notable increase of approximately 7.88% in the last three months. Despite being overbought according to the RSI, the index is under moderate selling pressure based on Money Flow indicators, though it is also showing signs of accumulation. The MACD remains bullish at 58.74, suggesting continued upward momentum in the near term.
In contrast, the Nasdaq index demonstrates even stronger performance metrics. Currently priced at 18,352.76, the Nasdaq is 45% above its 52-week low and, like the S&P 500, is at its 52-week high. The index has surged by 6.87% over the past month and an impressive 13.50% over the last three months. The Money Flow indicators suggest moderate buying pressure, and like the S&P 500, the Nasdaq is also overbought per the RSI. However, it is under accumulation, with a bullish MACD at 307.0, indicating that the upward trend may persist.
The Russell 2000 Small Cap index presents a different picture. With a current price of 2,026.73, it is 23% above its 52-week low but 4% below its 52-week high, signaling a more subdued performance relative to the other indices. The Russell 2000 has remained stable both over the past month and the last three months, lacking the significant upward momentum seen in the S&P 500 and Nasdaq. The Money Flow indicators show moderate selling pressure, and the index is neither overbought nor oversold according to the RSI. The MACD is bearish at -5.09, suggesting potential downside risks in the short term.
In summary, while the S&P 500 and Nasdaq show strong bullish trends and are both overbought yet under accumulation, the Russell 2000 appears to be lagging, with stability rather than growth characterizing its recent performance. Investors should weigh these technical indicators carefully, considering the broader market sentiment and individual risk tolerance when making investment decisions.
Last week vs. history (Large Cap S&P 500)
Market Commentary
Economic Indicators Signal Potential Cooling in U.S. Growth
In a recent turn of events, the U.S. economy appears to be showing signs of cooling, as indicated by the latest ISM manufacturing and services reports. For June, both metrics slipped below the critical 50-mark, signaling contraction in both sectors. The manufacturing sector has been particularly weak, with the ISM manufacturing index in contraction for 19 of the last 20 months. This comes as no surprise, given that consumer spending has shifted from goods to services post-pandemic. However, the recent softness in the services sector, which contributes over 70% of U.S. GDP, is a cause for concern.
The U.S. services sector, a traditional pillar of economic strength, has shown signs of deceleration, with two of the last three months falling into contraction. This shift suggests that consumers may be feeling the pinch of depleted pandemic-era savings and rising prices. If these trends persist, economic growth could slow to below-trend levels of 1.5% to 2%. The Atlanta Fed's GDP Now tracker already hints at a 1.5% growth rate for the second quarter, down from the 1.4% annualized growth in Q1. These figures fall well short of last year’s average 3.2% growth and the Fed’s forecast of 2.1% for 2024.
The labor market, another critical economic indicator, is also showing early signs of cooling. Recent data indicates a decline in job openings and quits rates, both nearing their lowest levels of the year. June's nonfarm payrolls report showed 206,000 new jobs, slightly above expectations but below the previous month's revised figure of 218,000. The unemployment rate ticked up to 4.1%, the highest in 26 months, yet still below the long-term average of around 5.5%. This softening is seen as a positive by the Fed, as it suggests a labor market that is cooling without collapsing.
As labor supply improves with rising labor force participation and increased immigration, demand for labor has moderated, leading to higher unemployment rates and moderated wage growth. This balance is crucial for the Fed, as it aims to cool the economy without triggering a recession. Lower wage growth, down from 4.1% to 3.9% year-over-year, could also signal softer services inflation ahead. Next week's consumer price index (CPI) report will be closely watched for further signs of easing inflation.
The recent decline in the ISM prices paid indexes for both manufacturing and services sectors adds to the narrative of easing price pressures. This could be a silver lining for the economy, as lower inflation might prompt the Fed to consider rate cuts sooner rather than later. The CME FedWatch tool now indicates a 72% probability of a rate cut in September, up from 58% just a week ago. Historically, markets have performed well in environments of cooling but positive economic growth, moderating inflation, and a dovish Fed.
In the equity markets, large-cap and mid-cap U.S. stocks may continue to lead, particularly those firms capable of delivering strong earnings. Sectors tied closely to economic growth might lag until the Fed's rate cuts potentially reignite consumer spending. Despite the cooling economy, corrections are expected and may be healthy for the market's long-term trajectory.
In the fixed-income space, longer-duration bonds within the investment-grade category are likely to perform well as economic growth slows and yields soften. The Fed's eventual pivot to rate cuts could further support this trend. Although substantial downside in longer-dated Treasury yields may be limited due to elevated deficits, bonds remain a meaningful source of income for long-term investors.
Overall, while the U.S. economy shows signs of cooling, the outlook remains cautiously optimistic. A moderated labor market and easing inflation could lead to a soft landing, a scenario welcomed by both the Fed and markets. Investors should continue to monitor economic indicators closely, as they navigate this evolving landscape. Balanced portfolios, with a mix of equities and bonds, remain a prudent choice for those with appropriate risk preferences and income needs.
As we await next week's CPI inflation report and further economic data, the market's focus will remain on the Fed's actions and their implications for future growth. The delicate balance between cooling economic activity and avoiding a recession will be crucial in shaping the financial landscape in the coming months. Investors are advised to stay informed and consider their long-term strategies amid these shifting dynamics.
Stock study for Tuesday
(LVS)
Las Vegas Sands Corp. (LVS) is a prominent global developer and operator of integrated resorts, which include accommodations, gaming, entertainment, retail malls, and convention facilities. The company has significant operations in Macao through Sands China Ltd. and in Singapore with Marina Bay Sands. LVS targets the profitable mass market gaming segment, capitalizing on the growth of the middle class and affluent individuals in Asia. Their extensive non-gaming amenities, such as high-end retail and MICE (meetings, incentives, conventions, and exhibitions) facilities, enhance customer experience and contribute to diversified revenue streams. The company is also committed to sustainability and corporate social responsibility through its Sands ECO360 and Sands Cares programs, earning recognition for its ESG efforts.


Comments ()