
The Monday Charge: July 22, 2024
Last week marked a significant period for the stock market as attention broadened from the evolving political landscape to notable shifts within the market itself. The anticipated rotation in market leadership, which had been one of the key predictions for 2024, began to materialize.

This is our Monday article, focusing on the large cap S&P 500 index. Just the information you need to start your investing week. As always, 100% generated by AI and Data Science, informed, objective, unbiased, and data-driven.
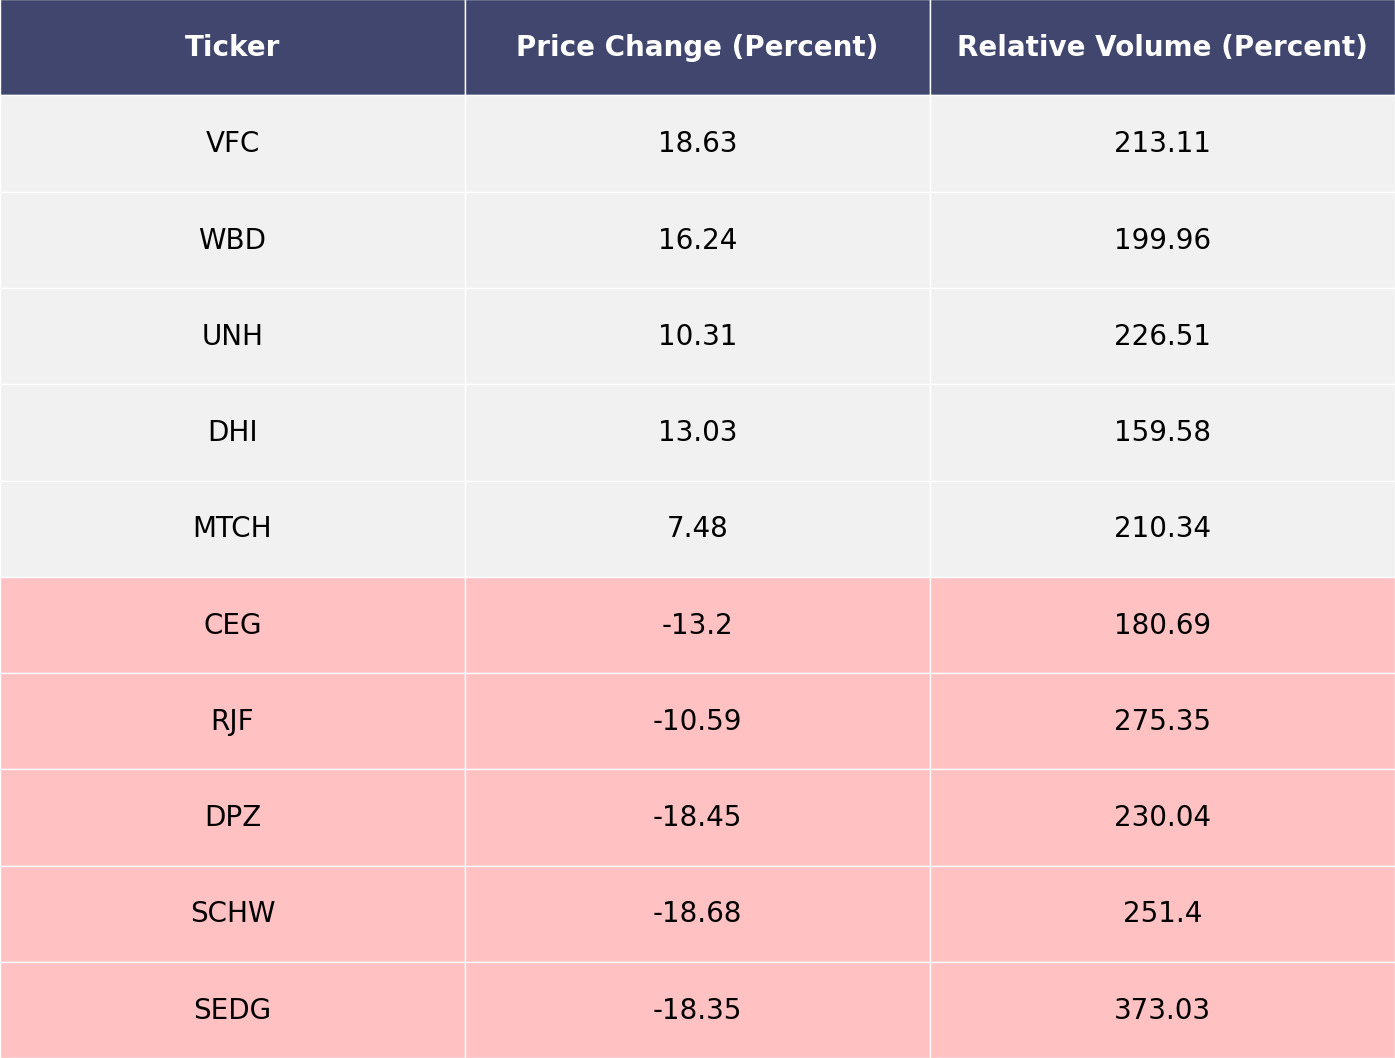
The biggest movers last week on price and volume (Large Cap S&P 500)
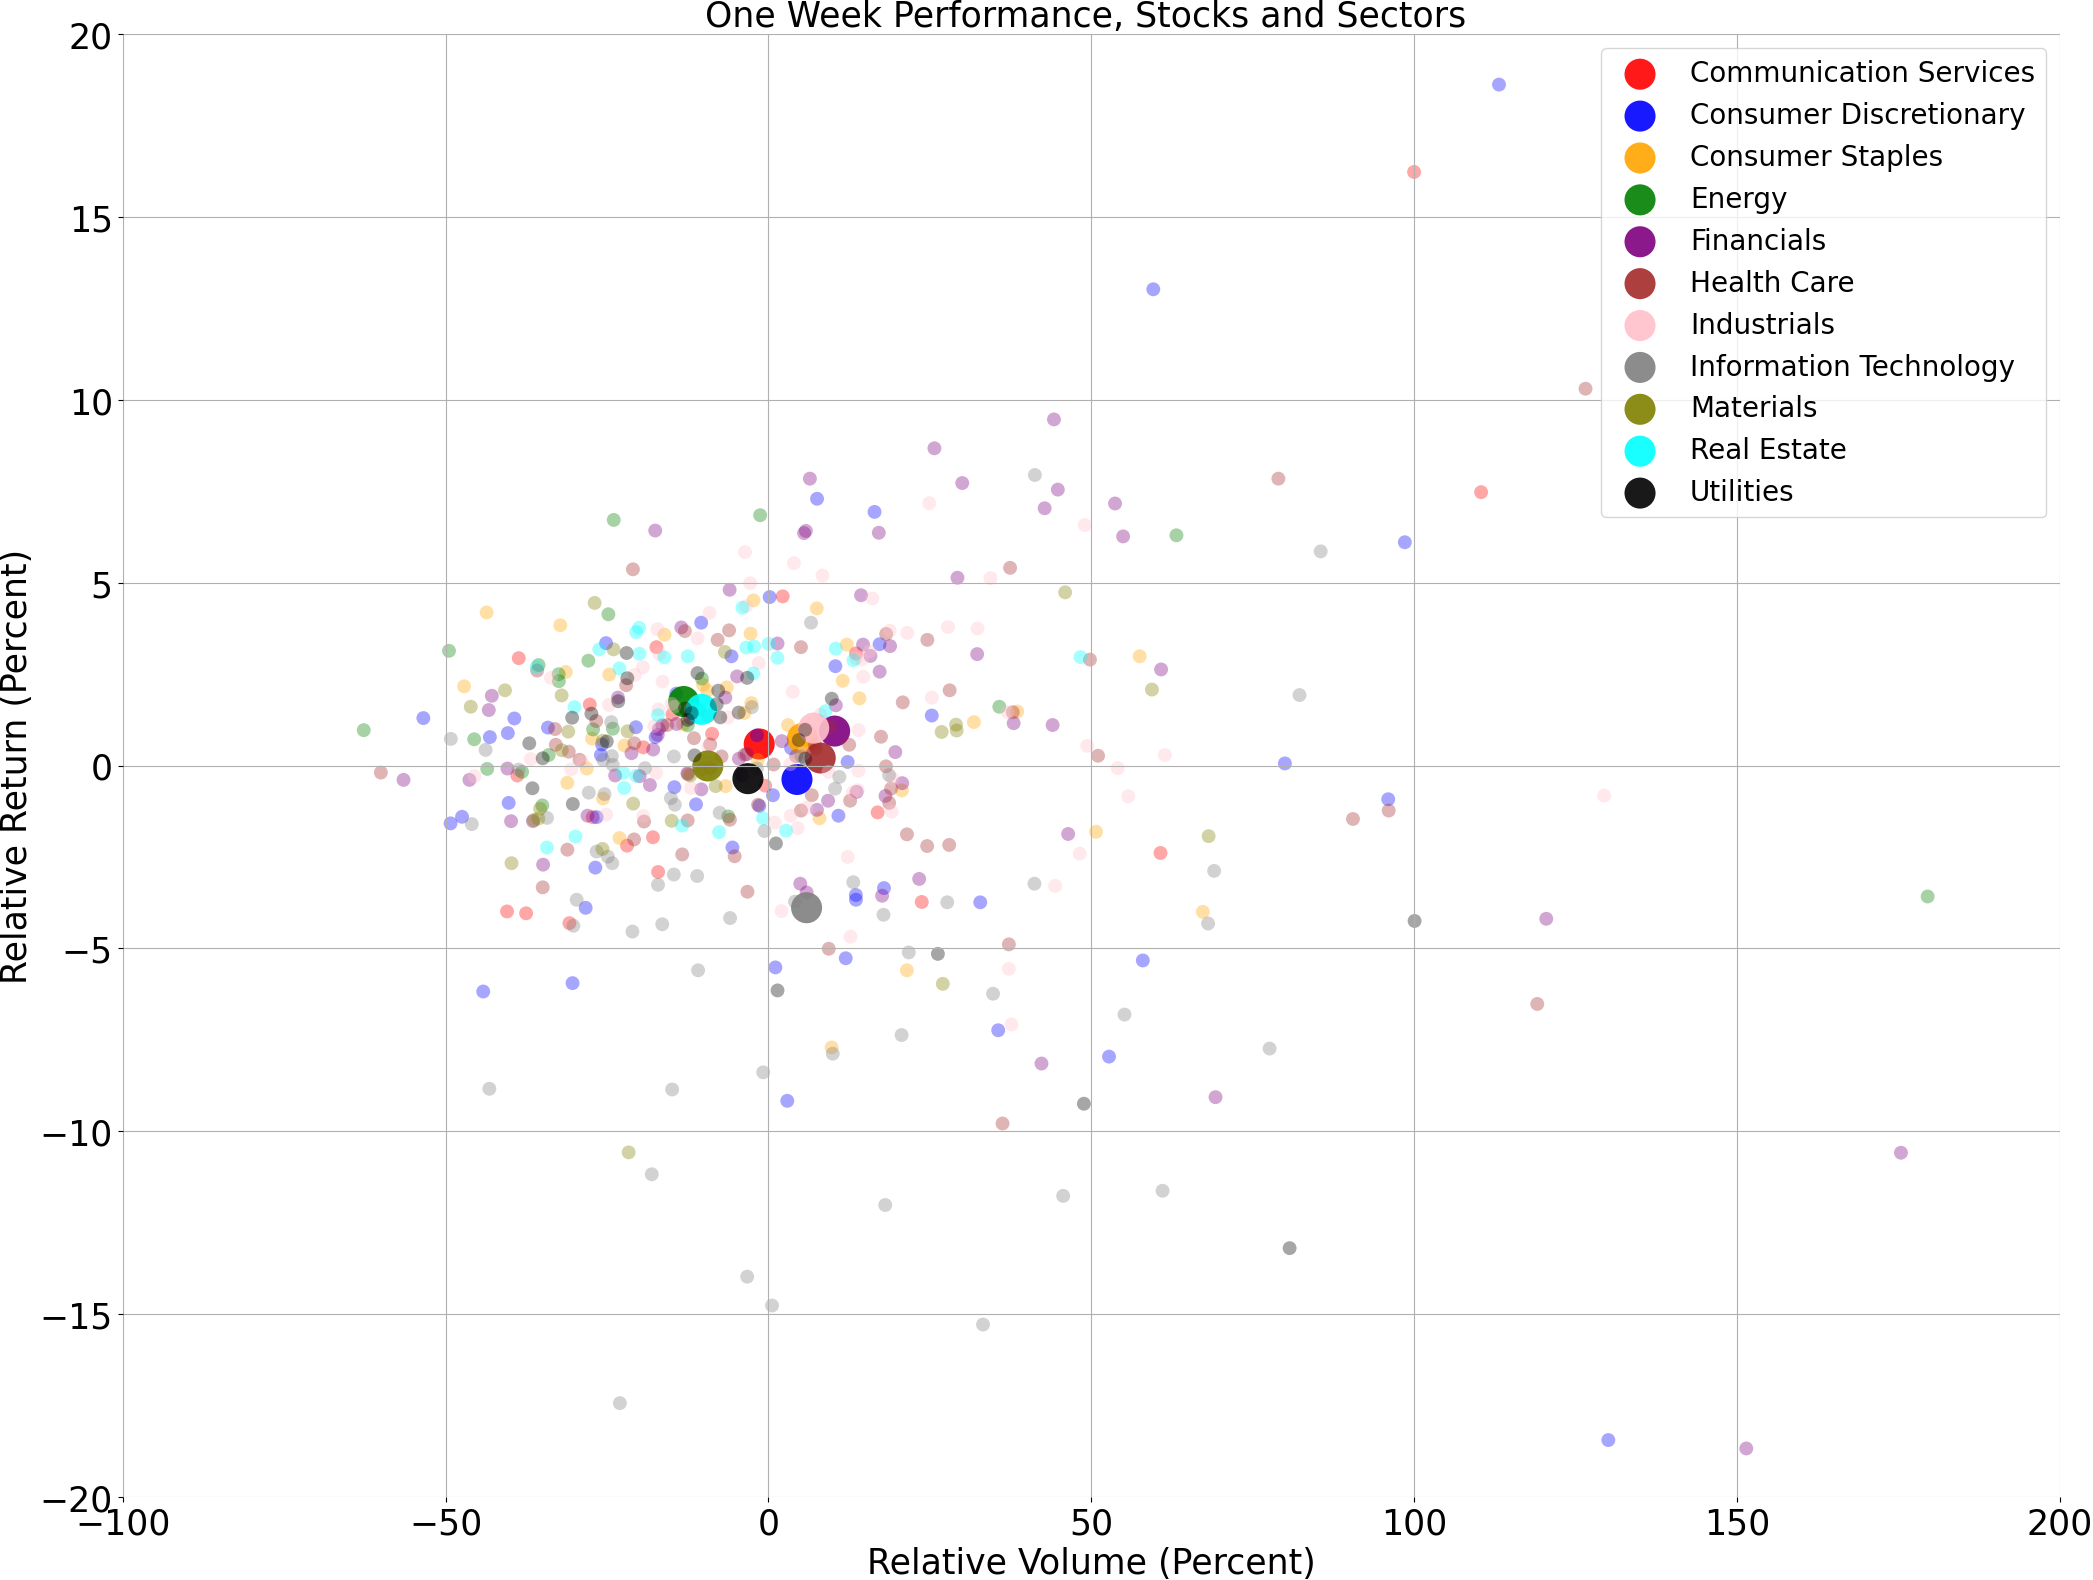
Price and volume moves last week for every stock and sector (Large Cap S&P 500)
A technical analysis across indices
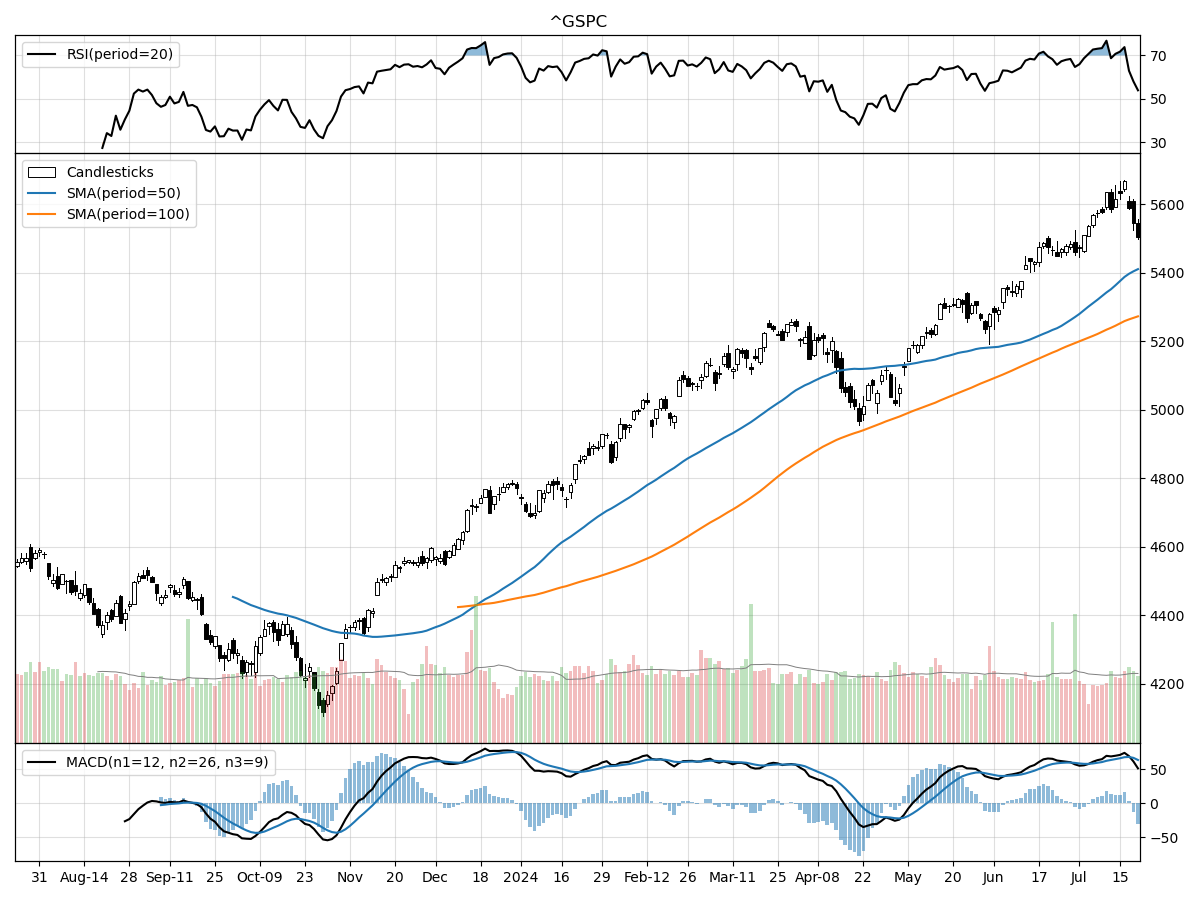
S&P500
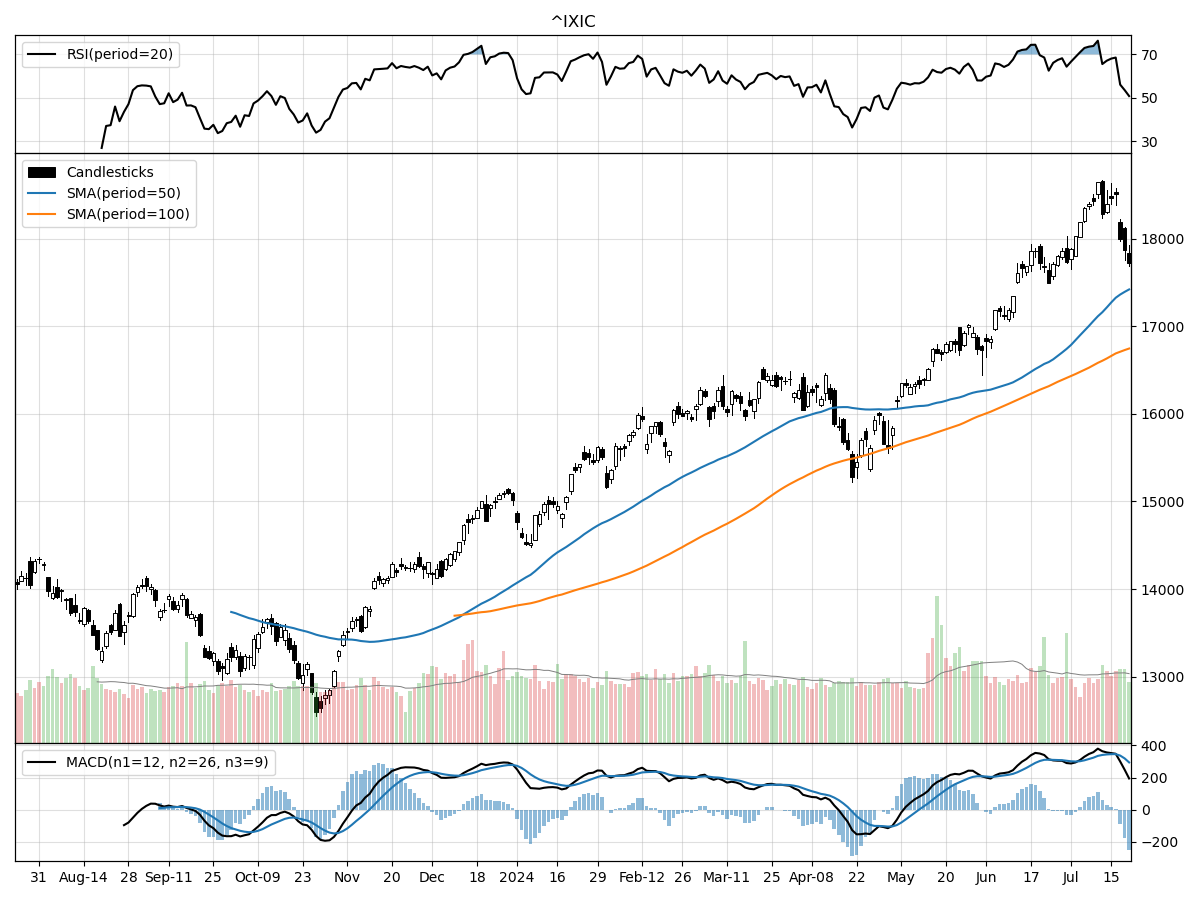
Nasdaq
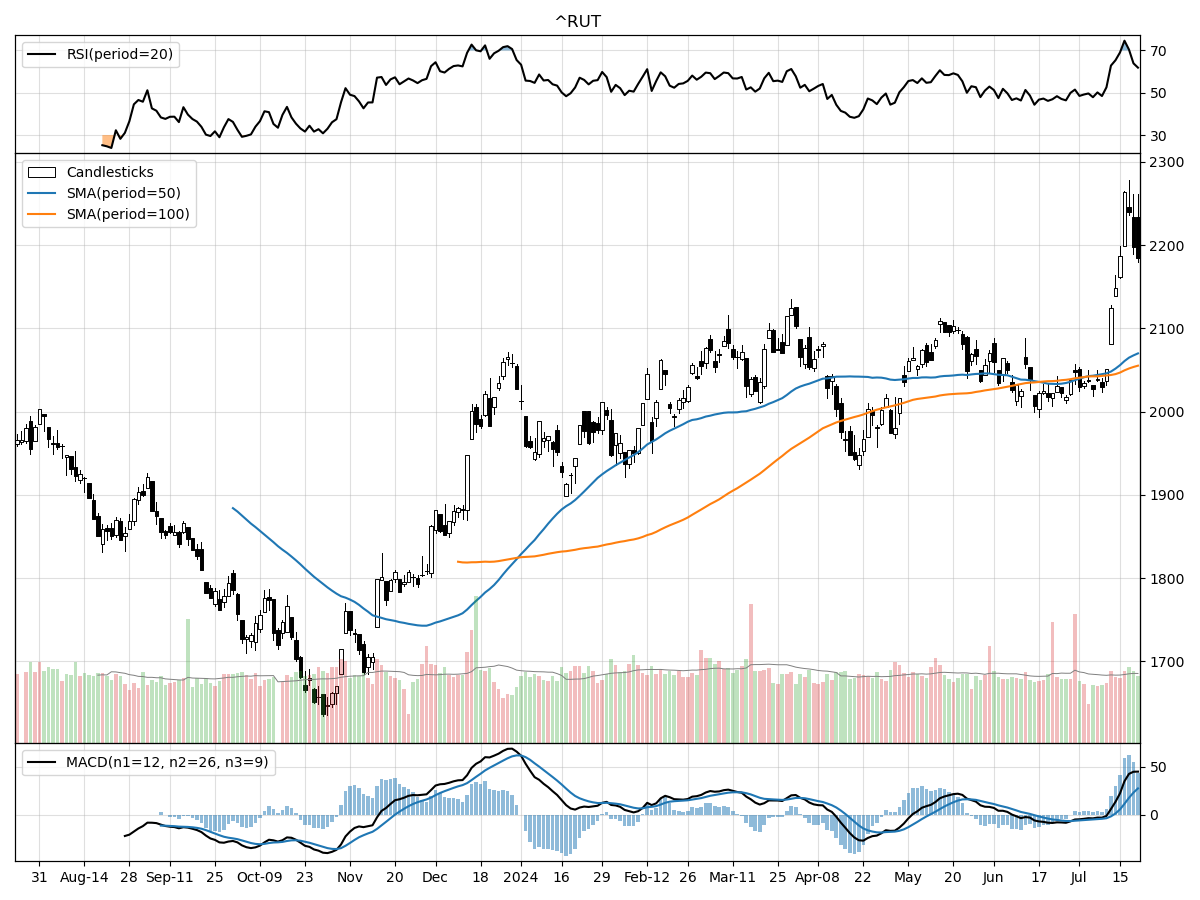
Russell 2000
Examining the technical performance across the S&P 500, Nasdaq, and Russell 2000 indices reveals a nuanced landscape. The S&P 500 currently trades at 5505.0, just 2% below its 52-week high and comfortably 33% above its 52-week low. Despite its relative stability over the past month, the index has posted a respectable 8.54% gain in the last three months. Money flow indicators suggest the S&P 500 is under moderate buying pressure but also under distribution, indicating that while there's interest, there's also a significant amount of selling. The MACD is bullish at 63.87, reinforcing the positive momentum.
In comparison, the Nasdaq index stands out with a current price of 17726.94, which is 40% above its 52-week low and 4% below its 52-week high. Over the last three months, the Nasdaq has surged by an impressive 12.82%. Unlike the S&P 500, the Nasdaq is under accumulation according to money flow indicators, suggesting robust buying interest and lower selling pressure. The MACD here is notably higher at 294.0, indicating a strong bullish trend. The index’s recent daily volume also exceeds its longer-term average, underlining heightened investor activity.
Meanwhile, the Russell 2000 trades at 2184.35, 33% above its 52-week low and 3% below its 52-week high. The Russell 2000 has shown substantial performance, rising 8.03% in the last month and 9.47% over the past three months. Like the Nasdaq, it is under accumulation, indicating strong buying activity. However, it is modestly overbought according to RSI, which could signal a potential short-term pullback. The MACD is bullish at 27.33, supporting the index's positive momentum. This index seems to be benefiting from renewed interest in small-cap stocks, often seen as a barometer of domestic economic health.
In summary, while all three indices are showing bullish technical indicators with strong MACD readings, the Nasdaq appears to be the most robust in terms of recent performance and accumulation, suggesting strong investor confidence. The S&P 500, though stable, shows a mix of buying and selling pressure, and the Russell 2000, while also under accumulation, has reached a modestly overbought status, warranting cautious optimism.
Last week vs. history (Large Cap S&P 500)
Market Commentary
Last week marked a significant period for the stock market as attention broadened from the evolving political landscape to notable shifts within the market itself. The anticipated rotation in market leadership, which had been one of the key predictions for 2024, began to materialize. This rotation suggests a move away from the concentrated dominance of the "Magnificent 7" technology stocks that defined 2023, toward a more diversified market leadership. While it's premature to declare a complete transition, the developments of the past week offer a glimpse into a potentially broader market rally.
One of the critical matchups observed was between stocks and interest rates, with the market pricing in a soft landing for the economy. The S&P 500 rallied as the 10-year U.S. Treasury yield showed a year-to-date decline, signaling investor optimism about economic stability. This shift indicates that investors are becoming more comfortable with the Federal Reserve's handling of inflation and interest rates, fostering a conducive environment for equities. However, it remains essential for investors to monitor these dynamics closely, as the interplay between stocks and rates will continue to influence market sentiment.
The second notable matchup was between mega-cap technology stocks and the broader market, highlighting signs of a leadership change. The S&P 500 Equal-Weight Index, which gives each stock an equal footing, outperformed the traditional S&P 500 index, which is heavily weighted by market capitalization. This performance disparity underscores a catch-up phase for smaller companies that had lagged behind the tech giants. Additionally, the Dow Jones Industrial Average outpaced the Nasdaq Composite, further illustrating the shift away from tech-centric leadership.
Sector-wise, cyclical sectors such as energy, financials, industrials, semiconductors, and communication services showed robust performance. This sector rotation indicates that investors are betting on an economic rebound, with these industries typically benefiting from increased economic activity. The resurgence in these sectors suggests that market participants are looking beyond the pandemic-induced tech boom and are now focusing on sectors poised to gain from a broader economic recovery.
Another significant aspect of last week's market activity was the rotation from large-cap to small-cap stocks. The Russell 2000 Index, which tracks small-cap companies, saw a sharp rally, outperforming the S&P 500. This rotation was fueled by increased expectations of an upcoming rate cut, which would benefit smaller companies typically more sensitive to borrowing costs. The renewed interest in small-caps indicates a growing investor confidence in the broader economic outlook and the potential for higher growth rates in this segment.
Economic data releases this week, including the second quarter GDP and PCE inflation data for June, will be crucial in shaping market expectations. Investors will be keenly watching these indicators to gauge the health of the economy and the Federal Reserve's future policy direction. Positive data could further bolster the case for a soft landing and continued market rally, while any negative surprises might prompt a reassessment of current valuations.
Craig Fehr, a principal and leader of investment strategy at Edward Jones, has been vocal about the evolving market conditions. He emphasizes the importance of diversification and systematic investing, especially in a market characterized by such dynamic shifts. Fehr's insights highlight the need for investors to stay informed and adaptable, ensuring their portfolios are well-positioned to navigate the changing landscape.
Investors should also remain mindful of the inherent risks in the market, including interest rate risk, credit risk, and market risk. Understanding these risks and their potential impact on investment portfolios is crucial for making informed decisions. While past performance can offer insights, it does not guarantee future results, underscoring the importance of a forward-looking investment strategy.
In conclusion, the recent market rotation underscores a potential shift in equity leadership, with a broader range of sectors and smaller companies gaining traction. As the market continues to evolve, staying informed and adaptable will be key for investors aiming to capitalize on emerging opportunities. The coming weeks will be critical in determining whether this rotation marks a sustained trend or a temporary adjustment, making it essential for investors to keep a close eye on economic data and market developments.
Stock study for Tuesday
(PAYC)
Paycom Software, Inc. is a leading provider of a comprehensive, cloud-based human capital management (HCM) solution delivered as Software-as-a-Service (SaaS). The company’s HCM solution supports various functions such as talent acquisition, payroll, and HR management through a single core system, enhancing data integrity and reducing administrative burdens. Founded in 1998 and publicly traded since 2014, Paycom focuses on innovative, in-house developed SaaS solutions that offer real-time analytics and business intelligence while minimizing compliance risks. The company has a strong client base of approximately 36,800 clients with a high annual revenue retention rate of 90-91%. Paycom emphasizes a user-friendly experience with specialized support, mobile app capabilities, and unique tools like Direct Data Exchange® and Beti® to enhance HR management and employee self-service.


Comments ()