
The Monday Charge: July 1, 2024
In an otherwise tranquil week for the markets, the release of fresh inflation data and the first presidential debate captured the spotlight.

This is our Monday article, focusing on the large cap S&P 500 index. Just the information you need to start your investing week. As always, 100% generated by AI and Data Science, informed, objective, unbiased, and data-driven.
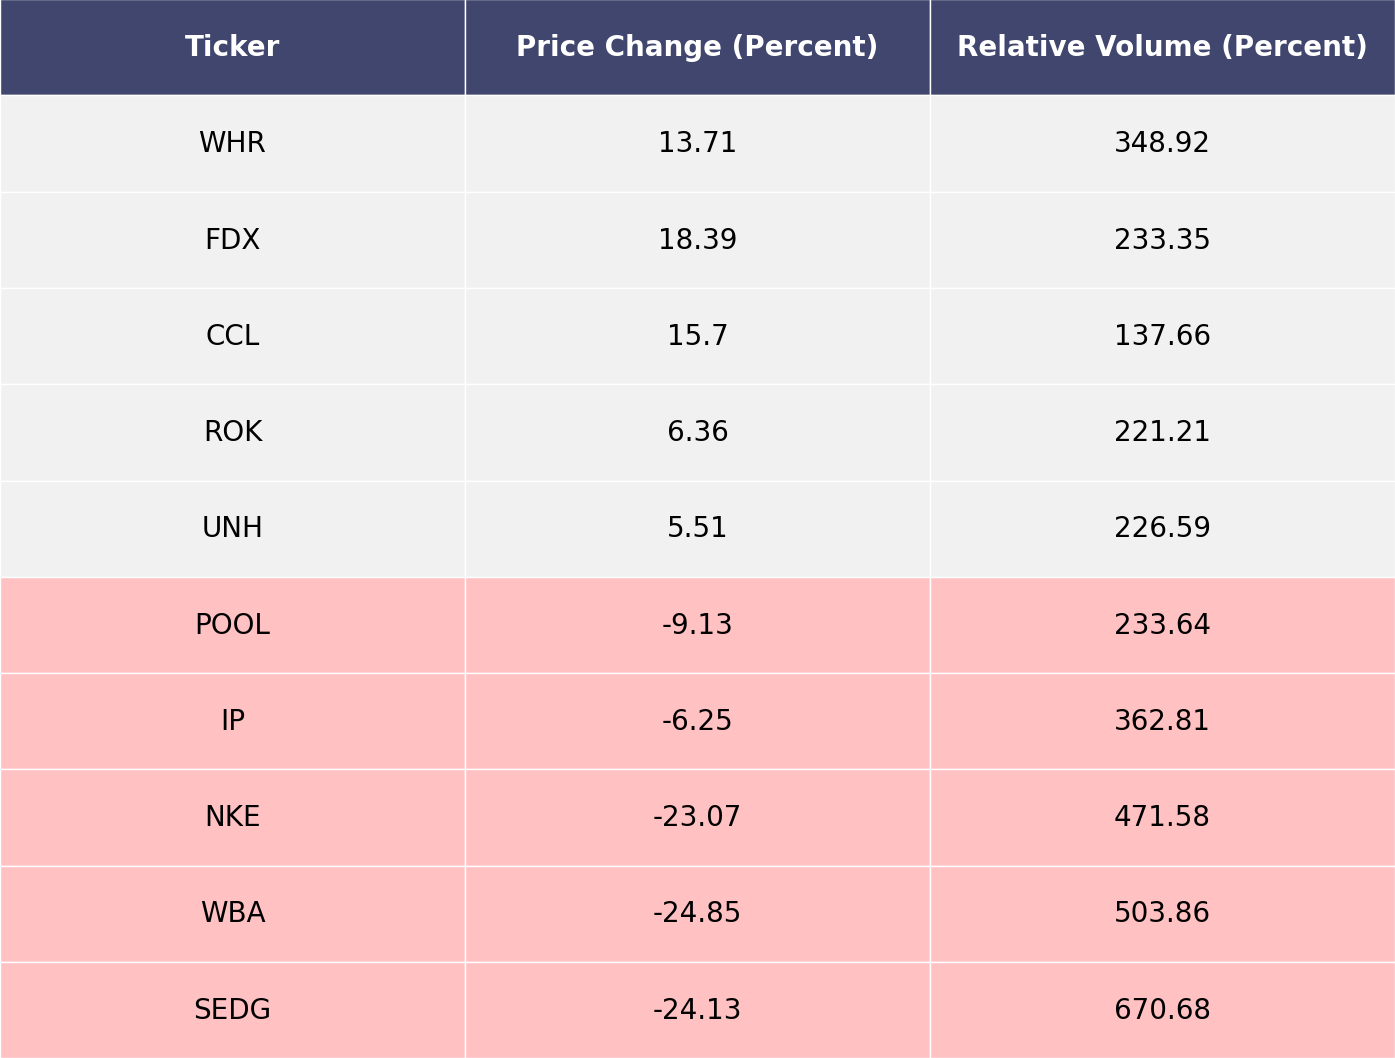
The biggest movers last week on price and volume (Large Cap S&P 500)
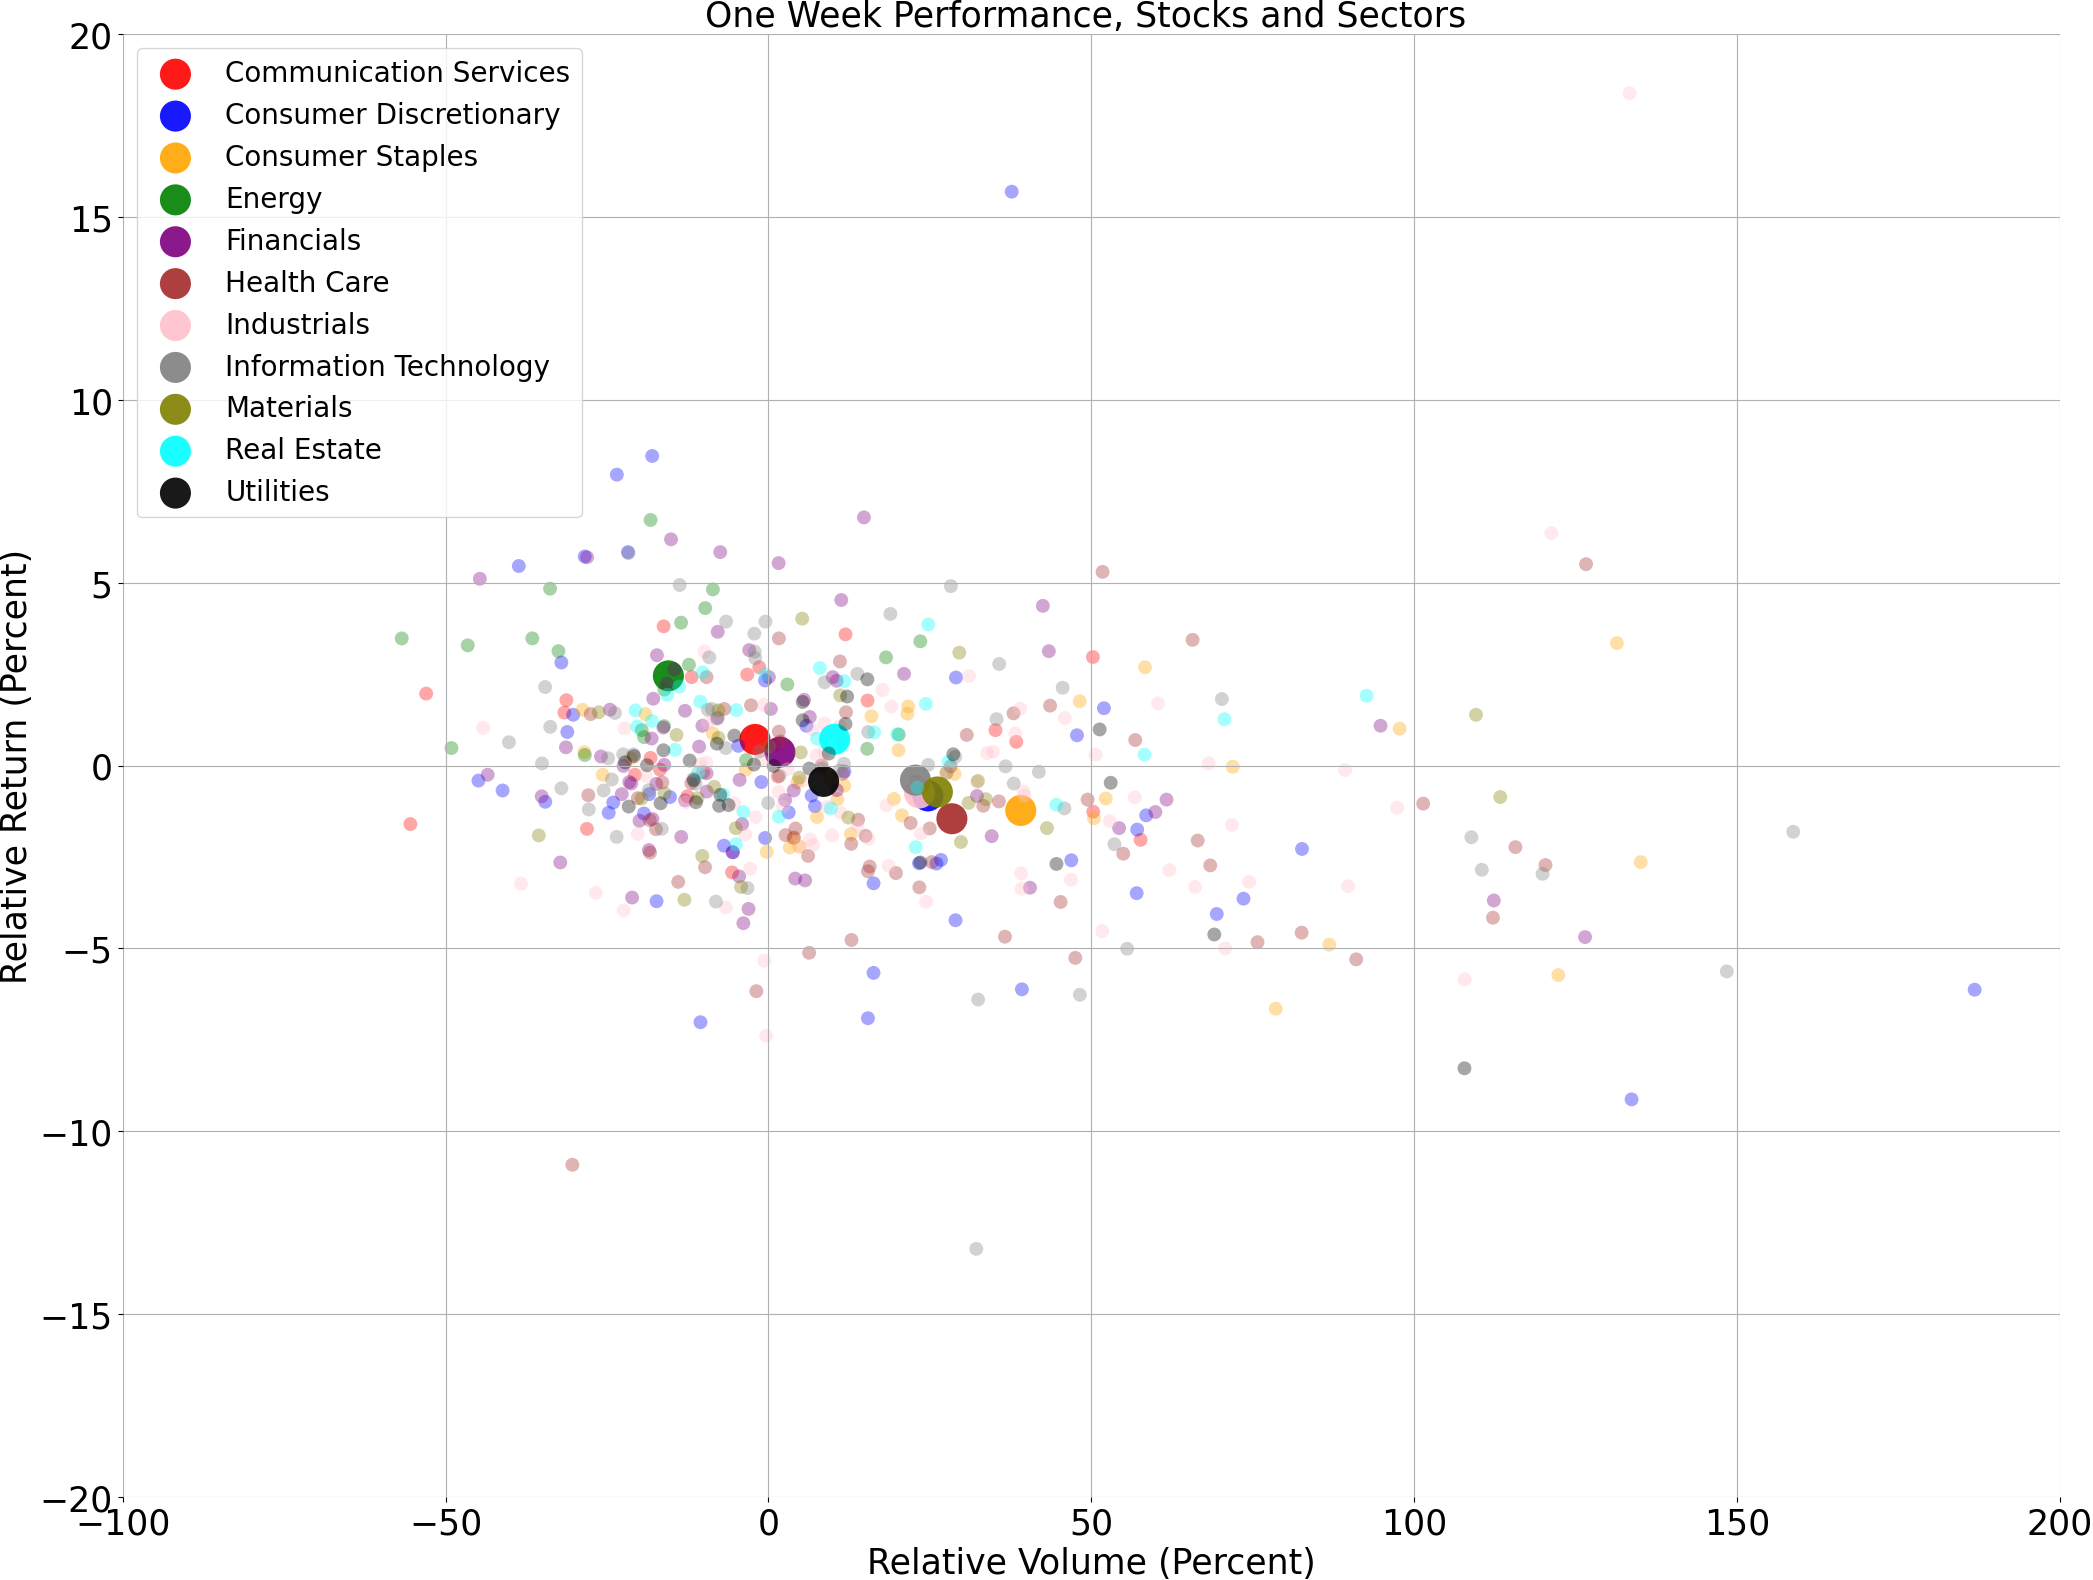
Price and volume moves last week for every stock and sector (Large Cap S&P 500)
A technical analysis across indices
S&P500

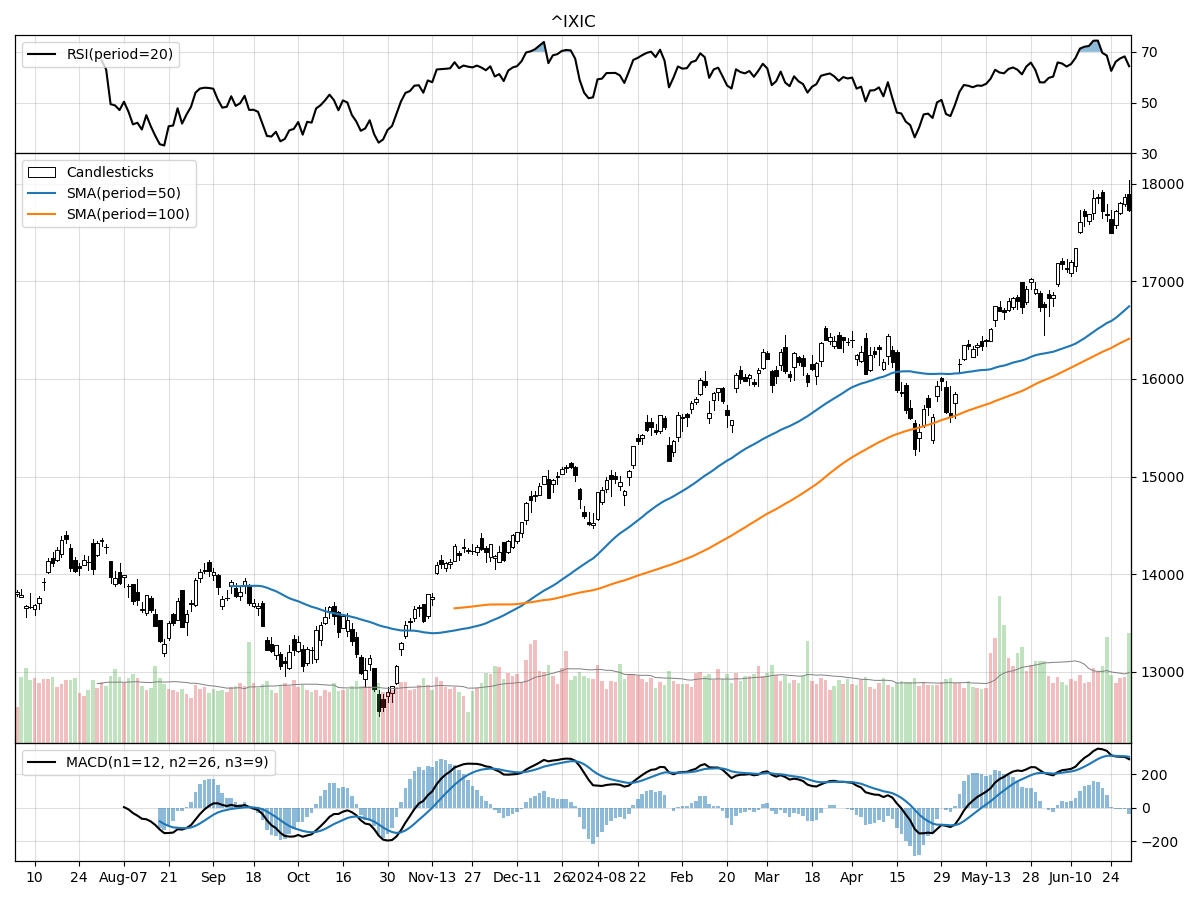
Nasdaq
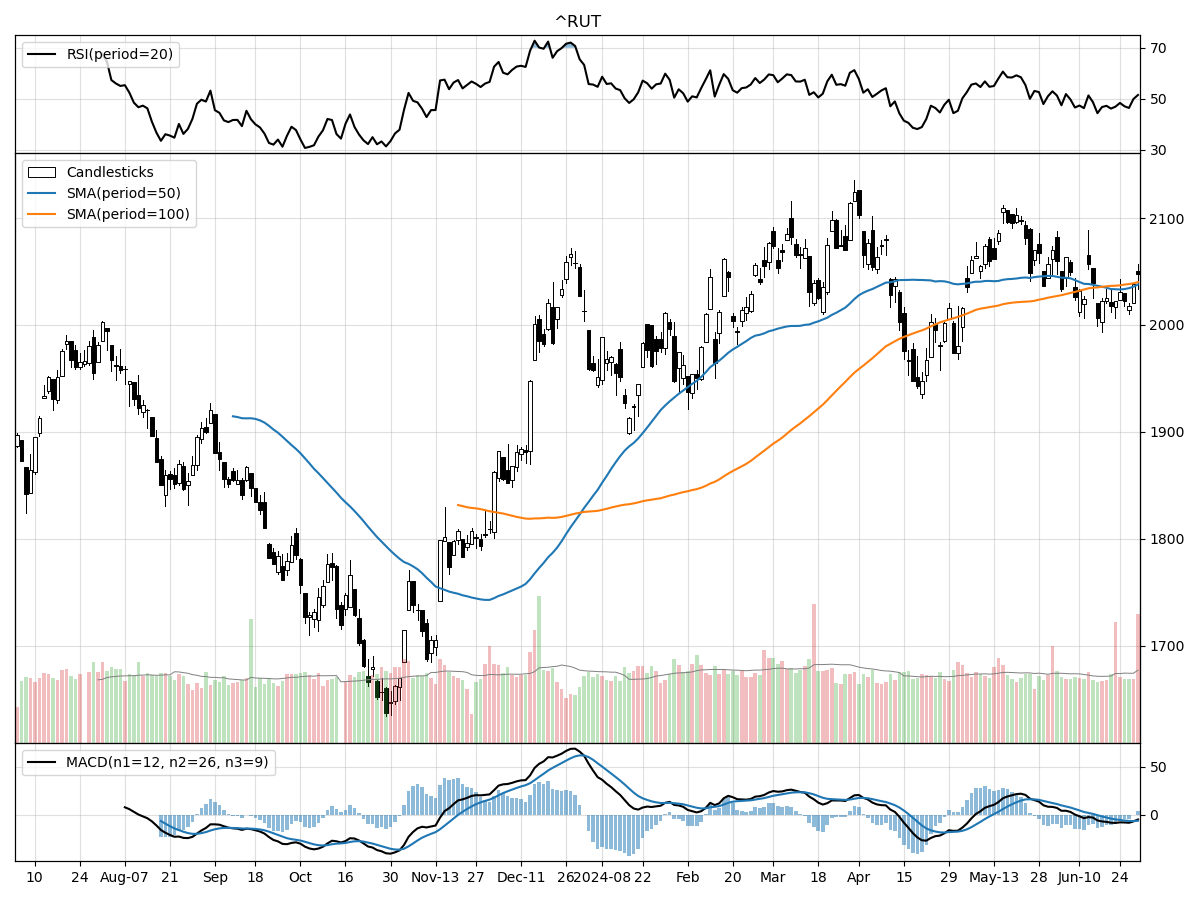
Russell 2000
The S&P 500 and Nasdaq indices are exhibiting strong technical performances, reflected in their current price levels, trading volumes, and positive momentum indicators. Both indices are sitting at their 52-week highs, with the S&P 500 up 32% from its 52-week low and the Nasdaq up a notable 40%. The Nasdaq has demonstrated particularly robust growth, rising 5.96% in the last month and 10.49% over the last three months, compared to the S&P 500's more modest three-month gain of 6.09%. Both indices are experiencing moderate buying pressure, as indicated by Money Flow indicators, and are under accumulation, suggesting continued investor confidence. The Relative Strength Index (RSI) for both indices shows they are modestly overbought, while the Moving Average Convergence Divergence (MACD) indicators are bullish, with the Nasdaq's MACD significantly higher at 304.3 compared to the S&P 500's 59.54.
In contrast, the Russell 2000 Small Cap index is lagging behind its larger-cap counterparts. While it is trading 25% above its 52-week low, it remains 3% below its 52-week high, indicating less bullish sentiment. The Russell 2000's price has remained relatively stable over the past month and three months, showing neither the upward momentum seen in the S&P 500 and Nasdaq nor significant declines. The index is under moderate selling pressure according to Money Flow indicators, which contrasts with the buying pressure observed in the larger indices. Furthermore, the MACD indicator is bearish at -6.42, suggesting a potential downtrend, although the RSI indicates that the index is neither overbought nor oversold. This mixed technical picture suggests a more cautious outlook for small-cap stocks relative to their large-cap peers.
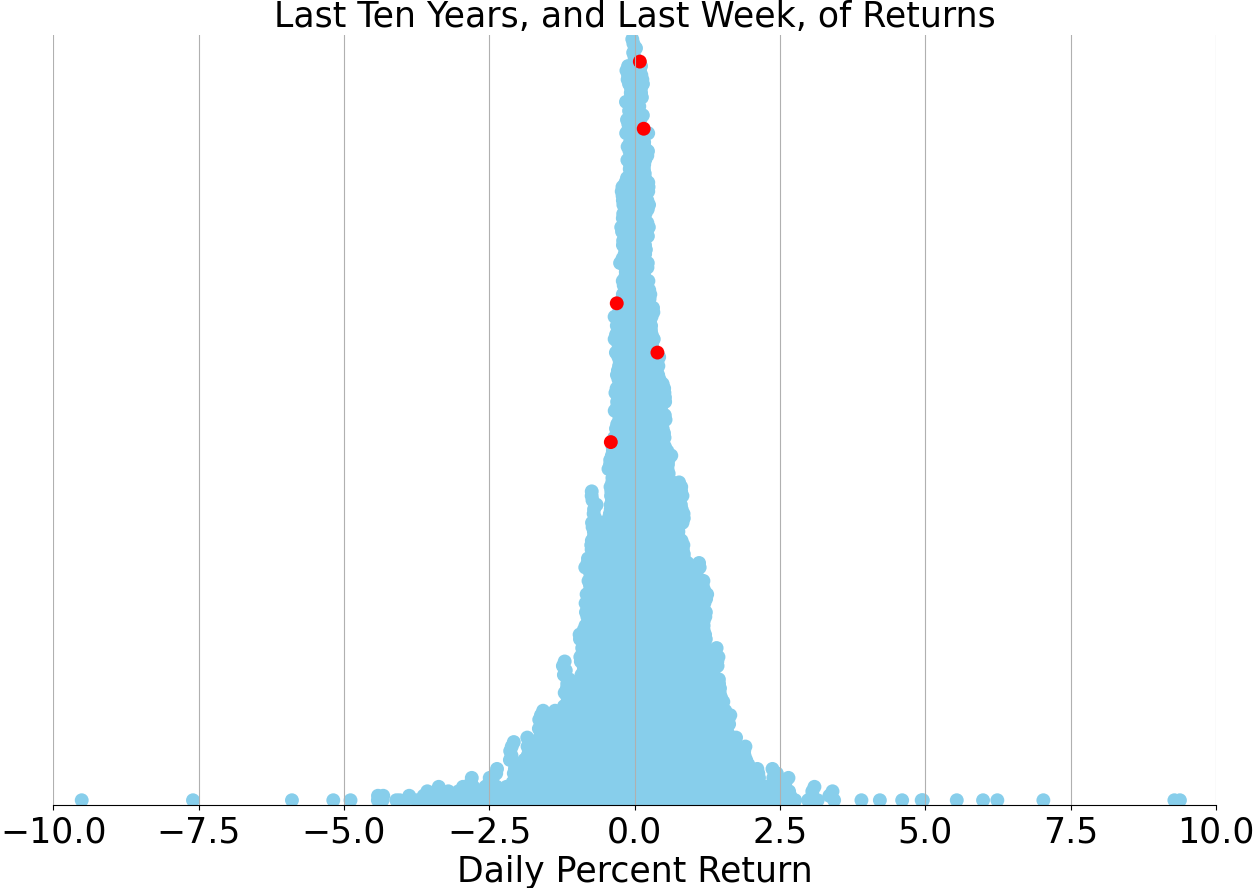
Last week vs. history (Large Cap S&P 500)
Market Commentary
In an otherwise tranquil week for the markets, the release of fresh inflation data and the first presidential debate captured the spotlight. As we conclude the first half of 2024, it is evident that the stock market has enjoyed a robust start. The S&P 500 has surged by more than 15% year-to-date, marking one of the strongest first halves since 1990. However, it is crucial to remember that past performance does not guarantee future results, and investors should remain vigilant.
Volatility has been notably subdued this year, with the VIX index reflecting the lowest levels of market turbulence in seven years. This calm has been a welcome change for investors, especially after the roller-coaster ride of recent years. The average daily volatility has reached historic lows, providing a stable environment for market participants. Yet, as with all market conditions, this tranquility could be fleeting.
Technology stocks have been the standout performers, driven by enthusiasm over artificial intelligence. The S&P 500 technology sector, along with companies like NVIDIA, has significantly outpaced the broader market indices such as the Dow Jones Industrial Average. This tech rally underscores the market's current infatuation with innovation and future growth prospects. However, the disparity between tech and other sectors raises questions about the sustainability of this trend.
Small-cap stocks, in contrast, have lagged behind their larger counterparts. The Russell 2000 Index, which tracks small-cap companies, has remained relatively flat after a late 2023 rally. High interest rates and signs of softer economic growth have weighed on these smaller firms. The rotation in relative performance between small- and large-cap stocks, which began in 2021, shows no signs of abating.
Defensive investments such as gold and utilities have experienced a resurgence from February through May. The S&P 500 utilities sector and gold prices have both seen significant gains, reflecting investor caution amidst broader market optimism. These traditionally safer assets often attract attention during periods of uncertainty, serving as a hedge against potential market downturns.
Despite technology's dominance, other sectors have started to close the performance gap in the first half of 2024. Communication services, for instance, have also posted impressive gains, each rising over 25% year-to-date. This broader sector participation suggests a more balanced market recovery compared to last year, where tech was the undisputed leader.
Longer-term interest rates have experienced a roller-coaster ride, initially rising before pulling back in recent months. The 10-year U.S. Treasury yield, a key benchmark for financial markets, has fluctuated as investors reassessed their expectations for Federal Reserve rate cuts. This volatility in bond yields reflects the ongoing debate about the future path of monetary policy.
As we look ahead, important economic releases such as the ISM manufacturing PMI and the nonfarm payrolls report for June will provide further insights into the health of the economy. These data points will be critical for investors as they navigate the second half of the year. With the market off to a strong start, the focus will now shift to sustaining this momentum amidst a backdrop of potential economic and political uncertainties.
In summary, the first half of 2024 has been marked by strong stock market performance, low volatility, and a tech-driven rally. However, the divergence between large-cap and small-cap stocks, along with the resurgence of defensive assets, indicates a complex and nuanced market environment. Investors would do well to stay informed and diversified, as the landscape could shift rapidly in response to new economic data and geopolitical developments.
Stock study for Tuesday
(TAP)
Molson Coors Beverage Company, with a brewing history of over two centuries, operates primarily in the Americas and EMEA&APAC regions, offering a diverse portfolio that includes both beer and non-beer beverages. Their core brands feature well-known names like Coors Light, Miller Lite, and Molson Canadian, alongside premium options such as Blue Moon Belgian White and craft beverages like Vizzy Hard Seltzer and Five Trail whiskey. In January 2020, the company rebranded from Molson Coors Brewing Company to Molson Coors Beverage Company to better reflect its expanded beverage offerings. The company’s Acceleration Plan focuses on growing core brand sales, premiumizing the portfolio, and expanding beyond traditional beer products. Strategic partnerships, such as with The Coca-Cola Company for Topo Chico Hard Seltzer, underscore Molson Coors' commitment to innovation and market diversification.


Comments ()