
The Monday Charge: February 25, 2024
In the financial world, the latest buzz centers around the S&P 500's remarkable ascent, which has seen the index soar by 24% since October last year, culminating in a series of record highs.

This is our Monday article, focusing on the large cap S&P 500 index. Just the information you need to start your investing week. As always, 100% generated by AI and Data Science, informed, objective, unbiased, and data-driven.
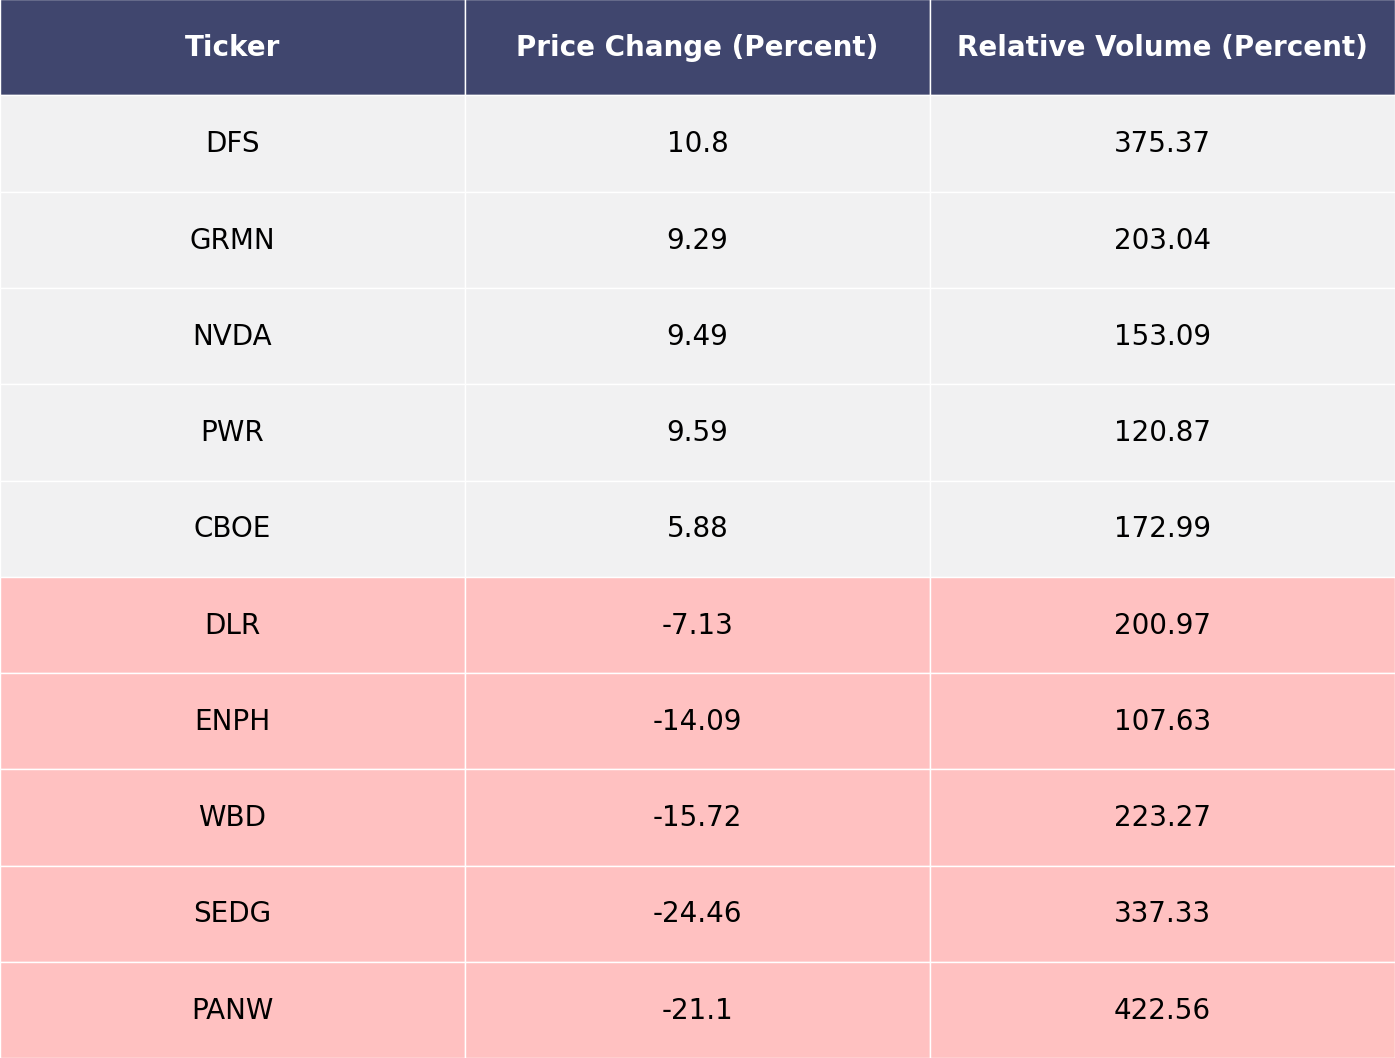
The biggest movers last week on price and volume (Large Cap S&P 500)
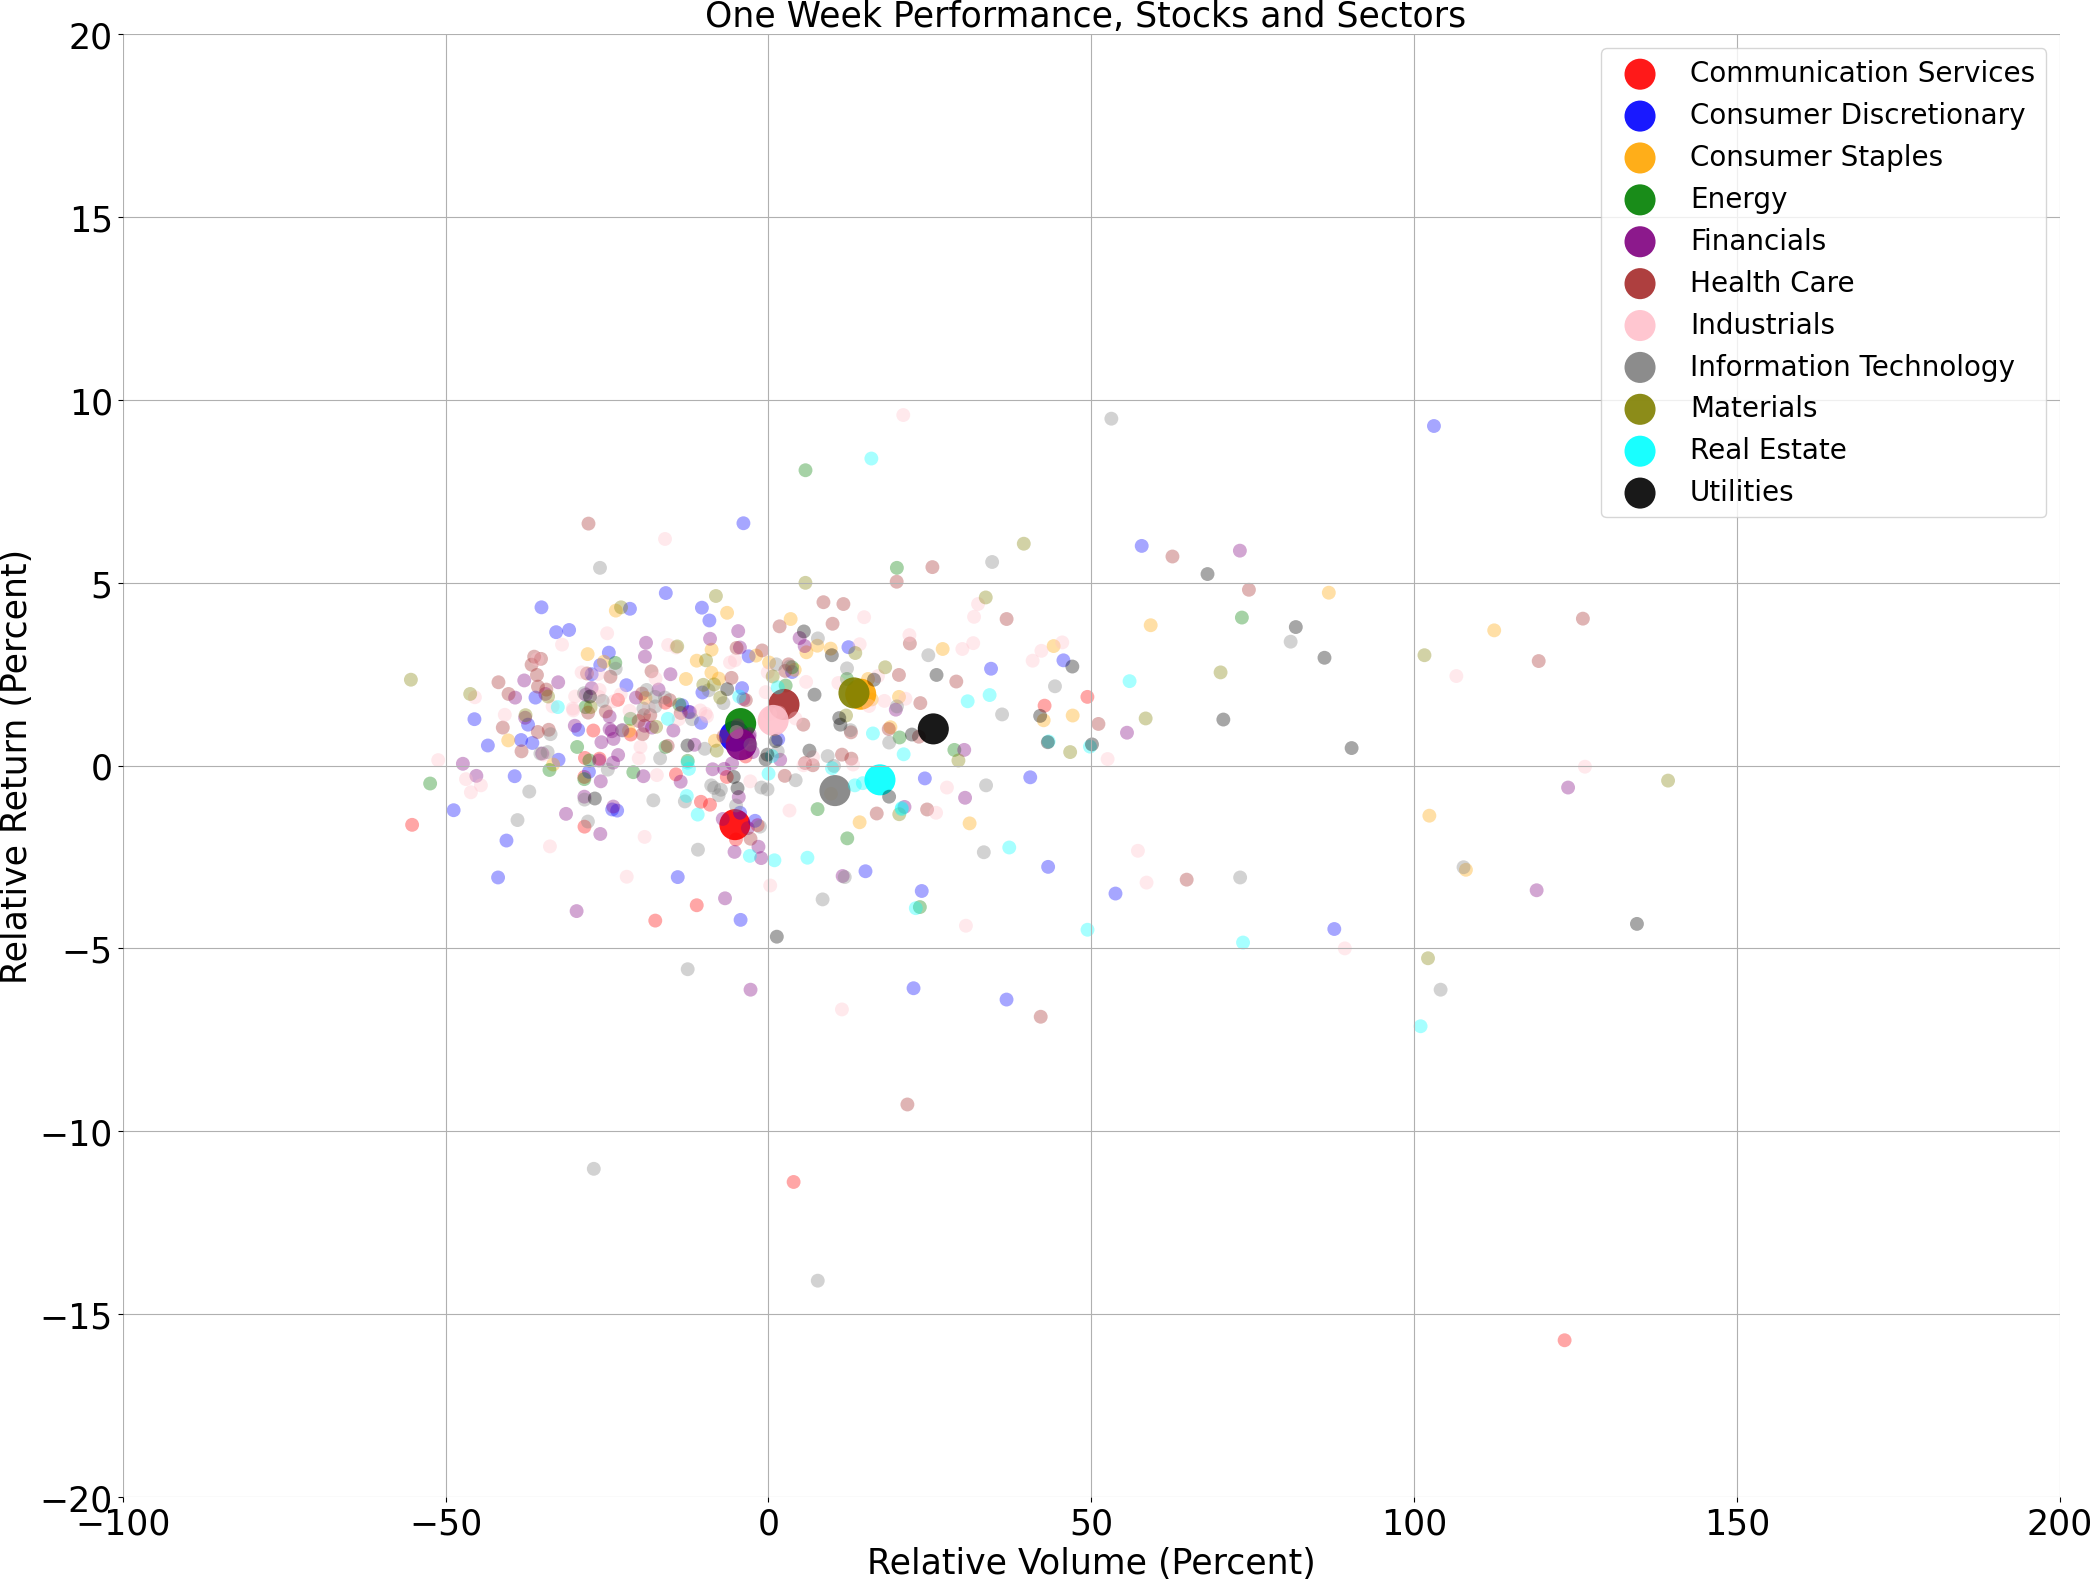
Price and volume moves last week for every stock and sector (Large Cap S&P 500)
A technical analysis across indices
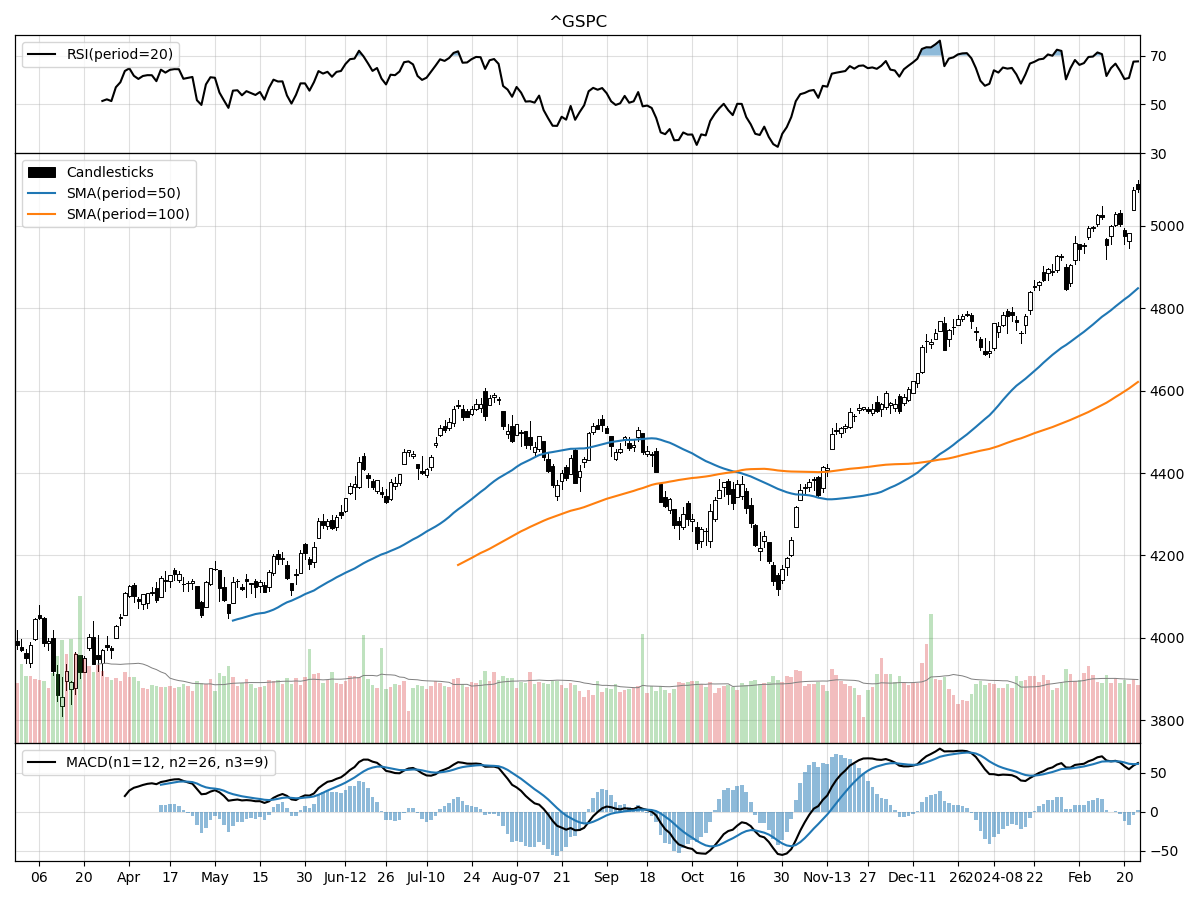
S&P500
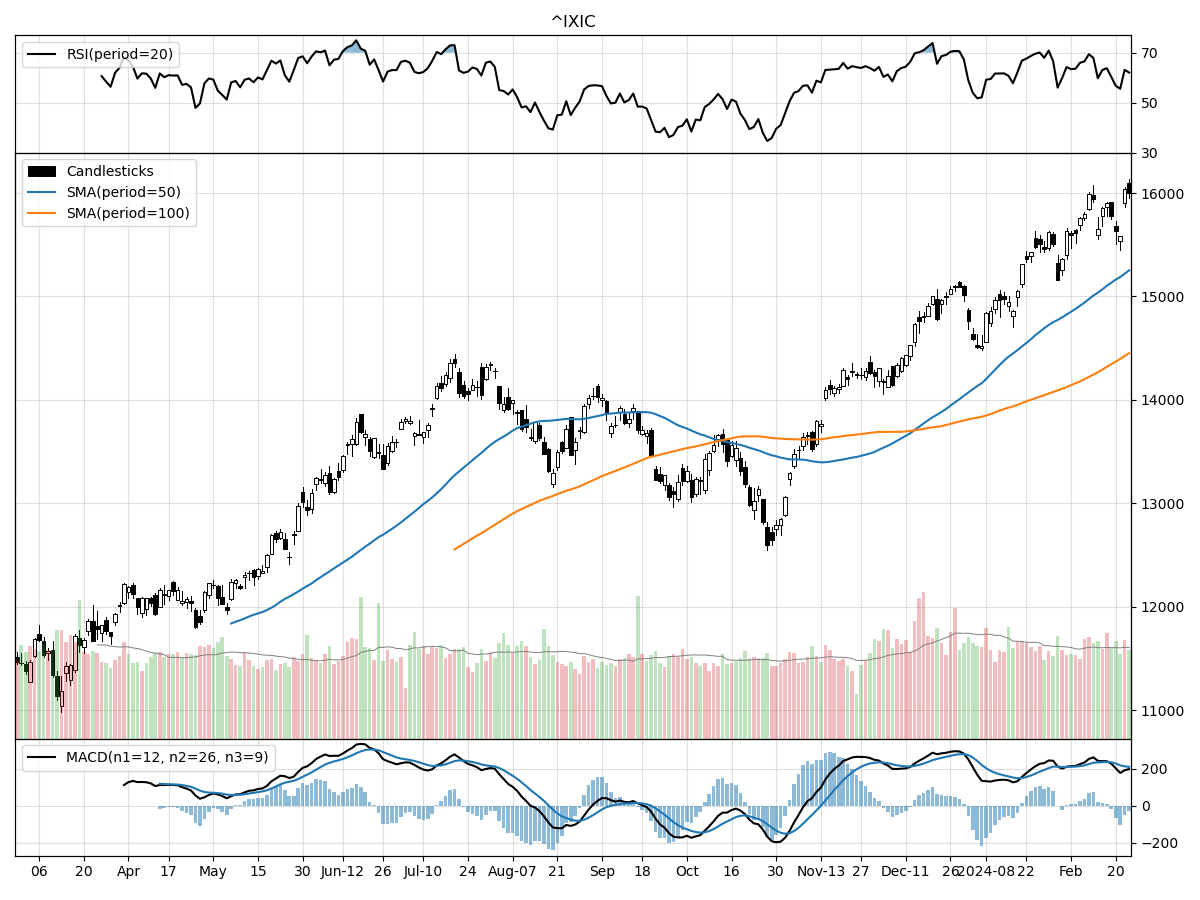
Nasdaq
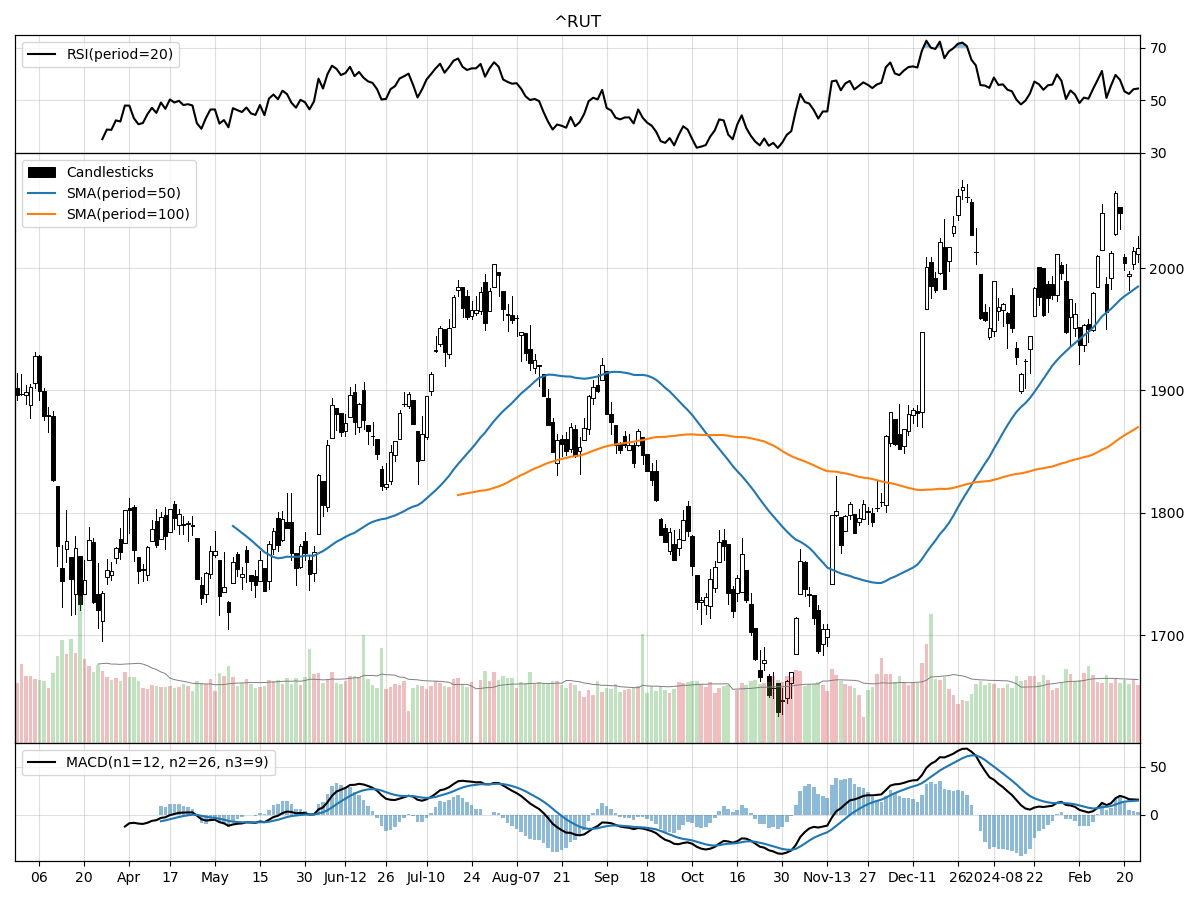
Russell 2000
The technical performances of the S&P 500, Nasdaq, and Russell 2000 Small Cap indices each present a unique picture for analysts and investors, with all three showing signs of positive momentum yet varying degrees of relative strength and market participation.
The S&P 500 index's current price stability and moderate buying pressure suggest a cautious optimism among investors, with the price being 31 percent above its 52-week low and at its 52-week high. The recent price trend indicates that the index has been consolidating its gains over the past month, with an 11.72% increase over the last three months. The index's Money Flow indicators and bullish MACD value of 61.09 reinforce this view, suggesting that the index is under accumulation. Although the RSI points to the index being modestly overbought, it does not yet signal a major concern for a potential trend reversal.
The Nasdaq index exhibits stronger relative growth, having risen 12.01% over the last three months, which is slightly higher than the S&P 500's performance for the same period. This index stands at its 52-week high and is 43 percent above its 52-week low, indicating a more robust recovery from its lows compared to the S&P 500. The Nasdaq's daily volume is higher than its long-term average, and with a MACD value of 209.4, the bullish sentiment is more pronounced than in the S&P 500. This could be reflective of the heavy tech orientation of the Nasdaq, which may benefit from industry-specific growth drivers or investor preferences for growth-oriented stocks in the current market environment.
The Russell 2000 Small Cap index, while also showing positive momentum with a 12.49% gain over the past three months, is different in that its price is still 2 percent below its 52-week high, indicating that it has not yet reached the level of full recovery seen in the other two indices. This might suggest a more tempered investor enthusiasm for small-cap stocks or a slower pace of accumulation. The index's RSI indicates a neutral position, suggesting that it is neither overbought nor oversold, which could imply a potential for continued growth without the immediate risk of a pullback due to overbought conditions. The Russell 2000's MACD of 14.60, while bullish, is lower than those of the S&P 500 and Nasdaq, which might point to a less aggressive bullish sentiment among investors in small-cap stocks.
In summary, while all three indices are currently experiencing bullish trends and accumulation, the Nasdaq stands out with the strongest bullish indicators and volume, followed by the S&P 500 with modest overbought conditions, and the Russell 2000 showing positive, yet comparatively restrained, market dynamics.
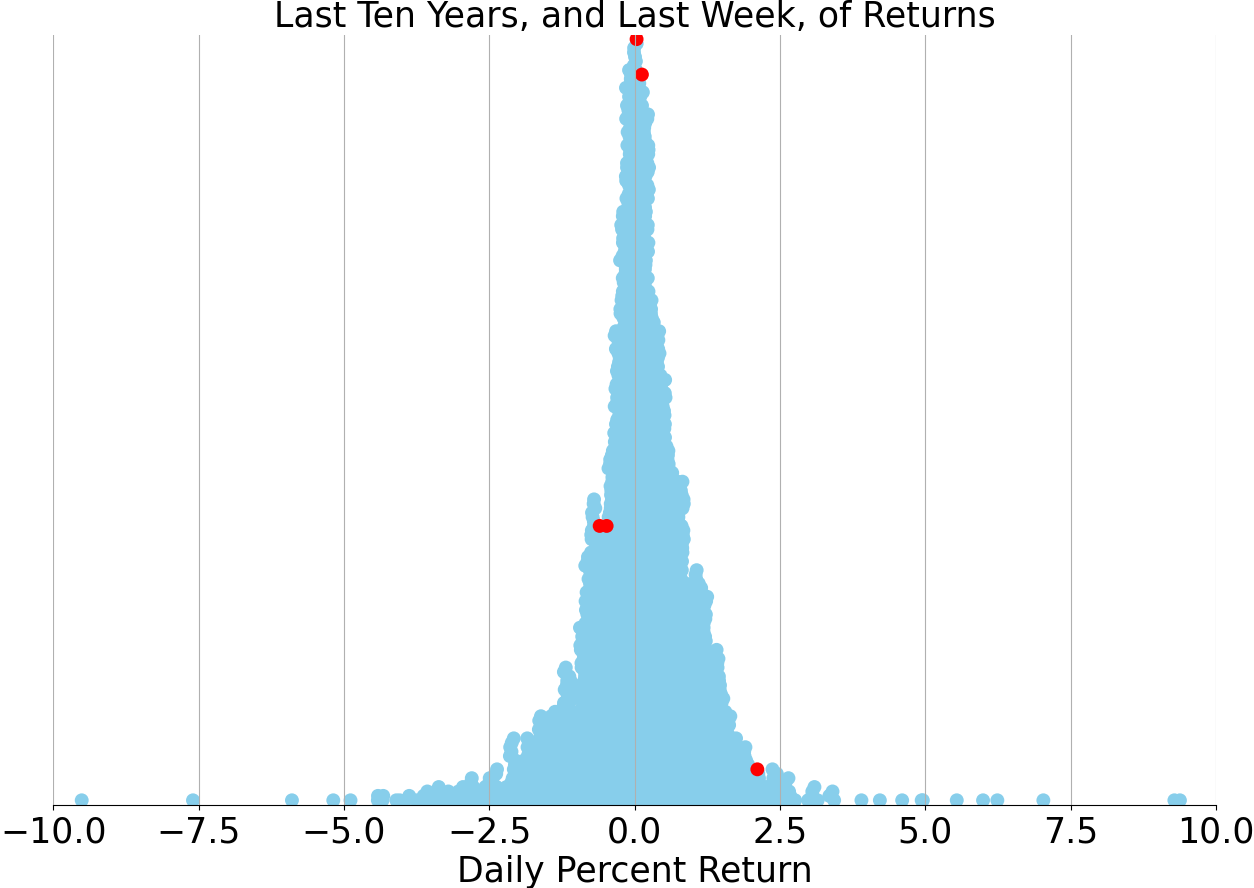
Last week vs. history (Large Cap S&P 500)
Market Commentary
Equity Markets Ride the Bull: A Look at the S&P 500's Record Surge
In the financial world, the latest buzz centers around the S&P 500's remarkable ascent, which has seen the index soar by 24% since October last year, culminating in a series of record highs. This surge, far from being an arbitrary stroke of luck, is underpinned by a combination of robust consumer spending and the anticipation of a dovish pivot from the Federal Reserve with expected rate cuts later in the year. The market's upward trajectory, which has seen a 6% increase in 2024 alone, reflects investor confidence in these significant economic tailwinds.
The rally, however, is not without its vulnerabilities. A significant portion of the market's gains can be attributed to a handful of technology giants, reminiscent of the late '90s tech boom, though today's leaders boast substantial earnings to back their valuations. Companies like NVIDIA, Microsoft, Alphabet, Amazon, and Meta have collectively generated a staggering quarter of a trillion dollars in earnings in 2023, suggesting a more grounded optimism compared to the speculative fervor of the dot-com era.
Despite the strong performance, there's an acknowledgment that the market's robustness is not impervious to corrections. The concentrated nature of the rally, with the top 10 S&P 500 companies accounting for about 29% of the market cap, means any significant news from these giants can sway the entire index. NVIDIA's recent earnings beat exemplifies this, as it provided a significant boost to the market, demonstrating how pivotal such announcements have become.
The market's resilience has also been tested by the Federal Reserve's stance on inflation and interest rates. In early 2023, hawkish signals from the Fed led to a recalibration of expectations and a subsequent 7% market dip over the following month. A similar pattern emerged mid-year when the Fed's "higher for longer" interest rate message triggered a 10% correction. However, the market's recovery, despite a rise in yields, indicates a growing belief in the underlying strength of the current bull market.
Historical patterns suggest that reaching new highs often precedes further gains, and the S&P 500's track record supports this trend. While past performance is not a guarantee of future results, there's a historical precedent for continued growth following the establishment of new market peaks.
Sector performance has also begun to even out, with recent months showing a broader participation beyond the tech-heavy leads. This diversification across sectors can contribute to the market's stability and mitigate the risks associated with a narrow leadership base.
In conclusion, while the market's rally has been impressive, it's essential to recognize the potential for volatility, particularly given the concentration of gains in a few large-cap stocks. Nonetheless, the underlying economic indicators, coupled with historical trends, suggest that the current bull market may still have room to run. Investors are advised to remain vigilant, diversify their portfolios, and stay attuned to the broader market fundamentals as we navigate through 2024's financial landscape.
AI stock picks for the week (Large Cap S&P 500)


