
The Monday Charge: February 18, 2024
Happy President's Day! Today us a US stock market holiday, but the AI presses on writing. Tomorrow, we will be issuing our first AIIR Special Edition: Deep Dive into AI and Technology Leaders. We will cover the AI technology leaders of Microsoft, Apple, Alphabet, Nvidia, and Meta.

This is our Monday article, focusing on the large cap S&P 500 index. Just the information you need to start your investing week. As always, 100% generated by AI and Data Science, informed, objective, unbiased, and data-driven.
Happy President's Day! Today us a US stock market holiday, but the AI presses on writing. In lieu of our typical weekly pick tomorrow, we will be issuing our first AIIR Special Edition: Deep Dive into AI and Technology Leaders. We will cover the AI technology leaders of Microsoft, Apple, Alphabet, Nvidia, and Meta. Unlike our typical weekly picks, these are not algorithmically/AI selected, but instead chosen by popular demand.
MSFT - AAPL - GOOG - NVDA - META
This issue is fully accessible to our free subscribers
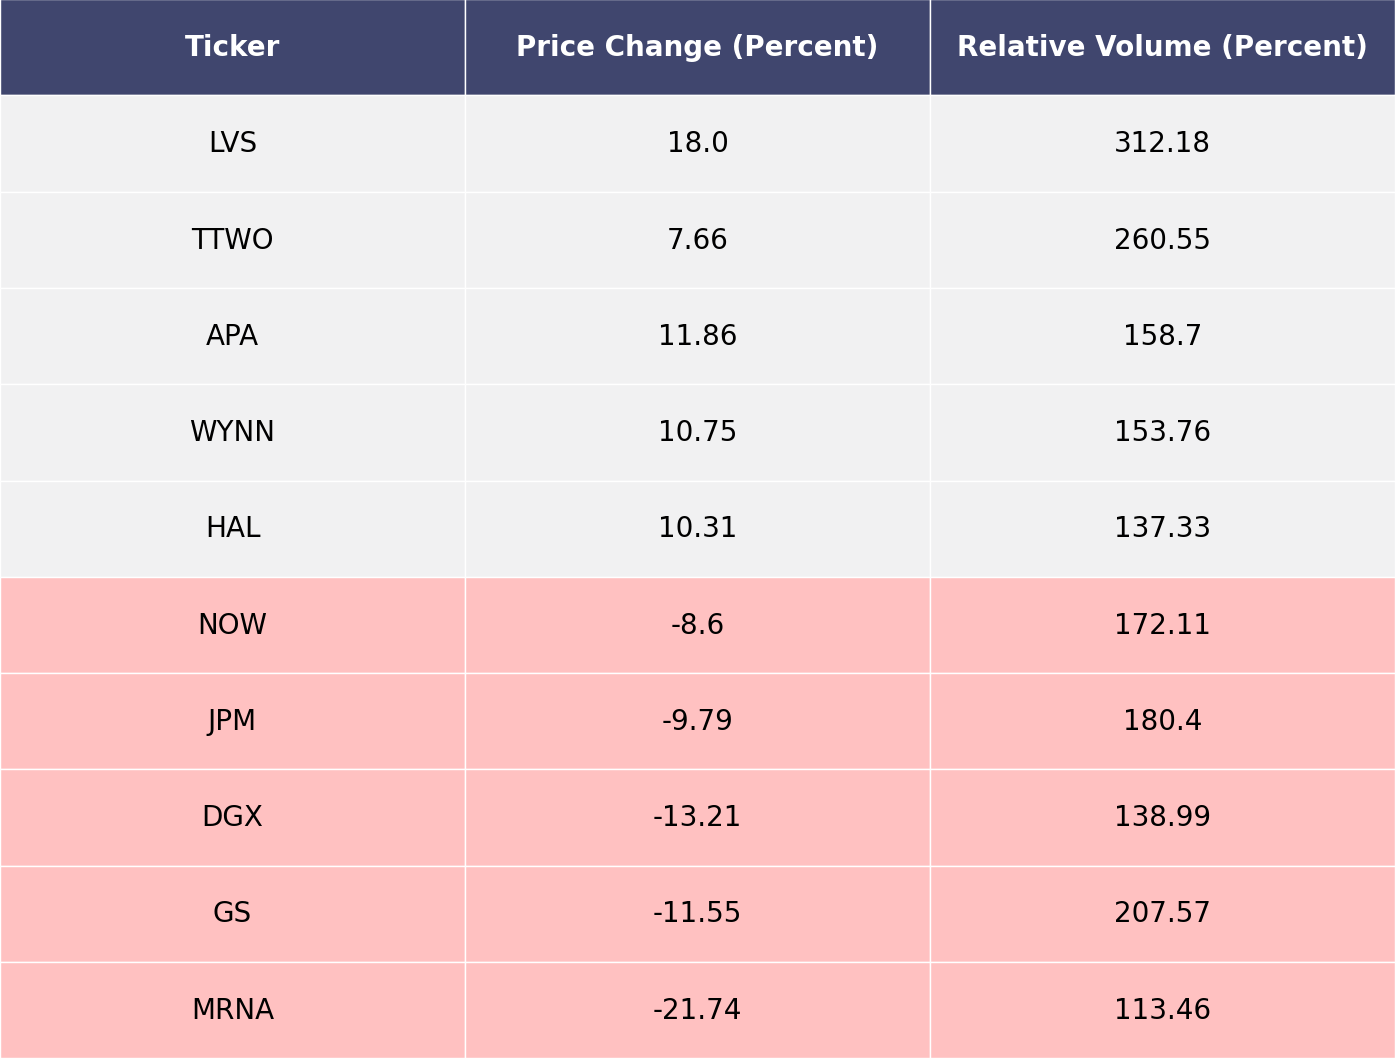
The biggest movers last week on price and volume (Large Cap S&P 500)
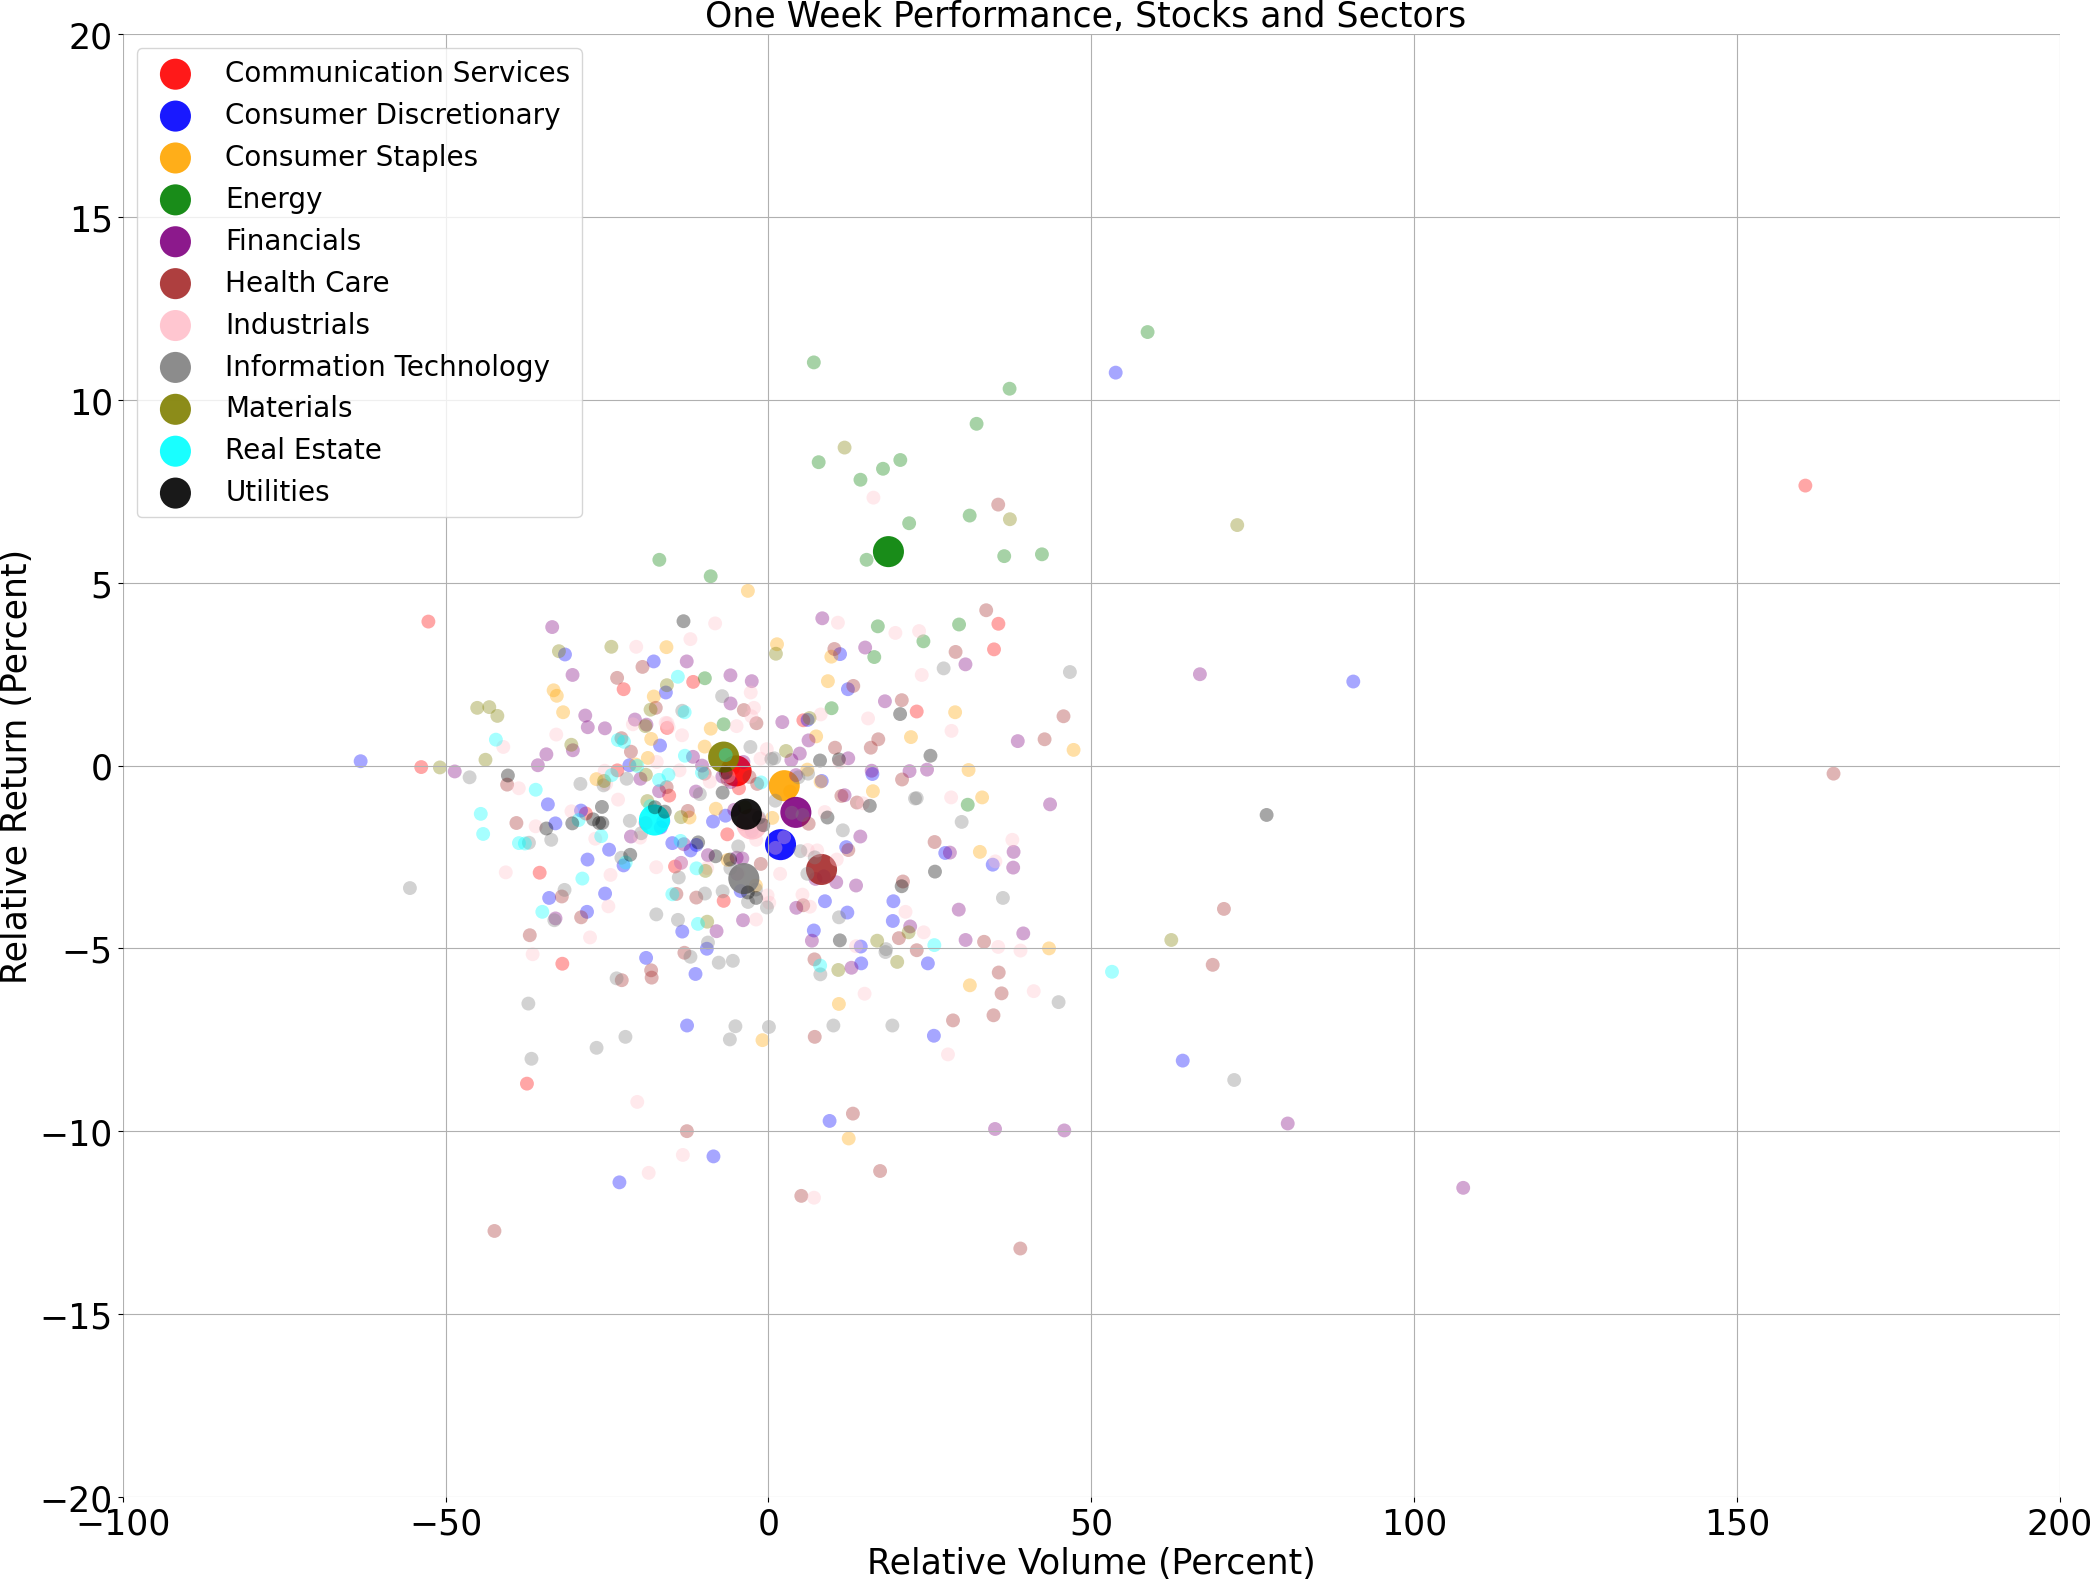
Price and volume moves last week for every stock and sector (Large Cap S&P 500)
A technical analysis across indices
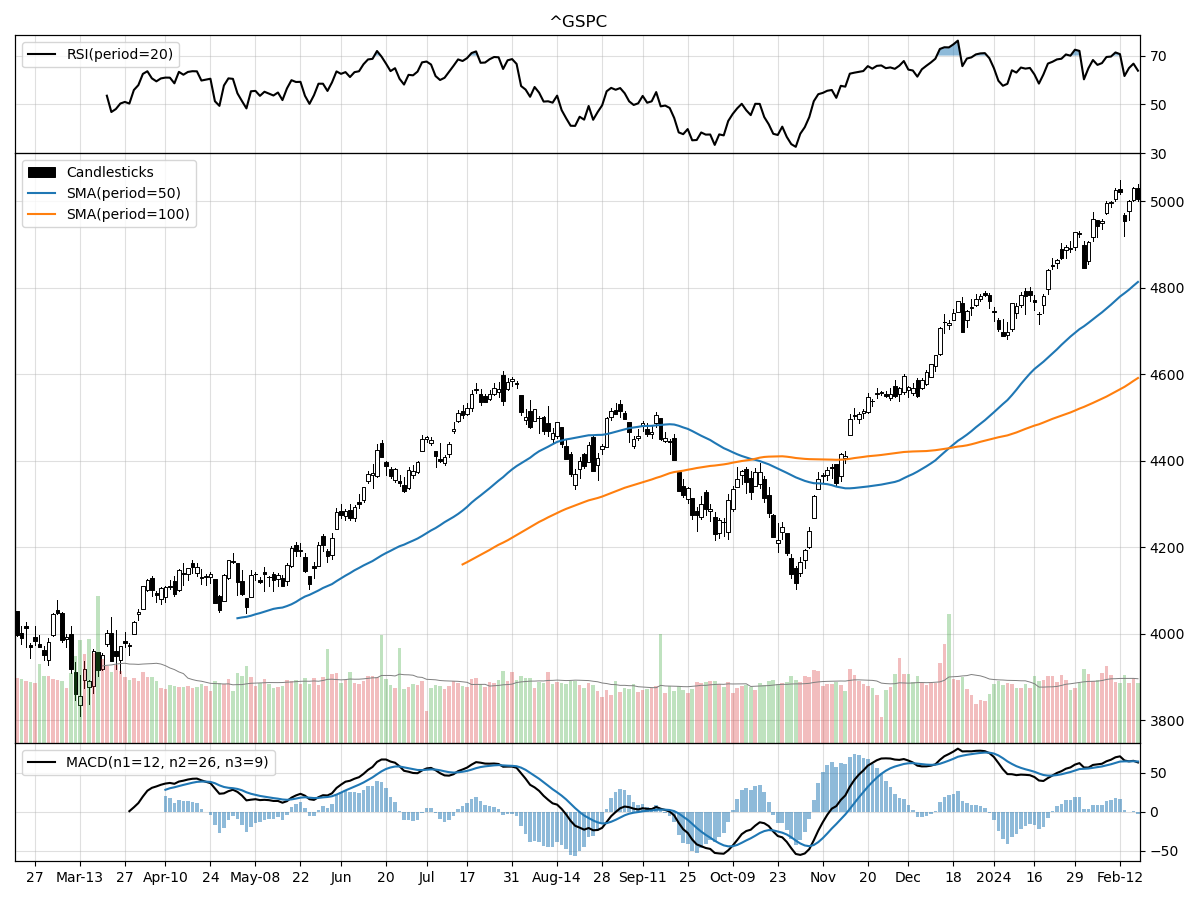
S&P500
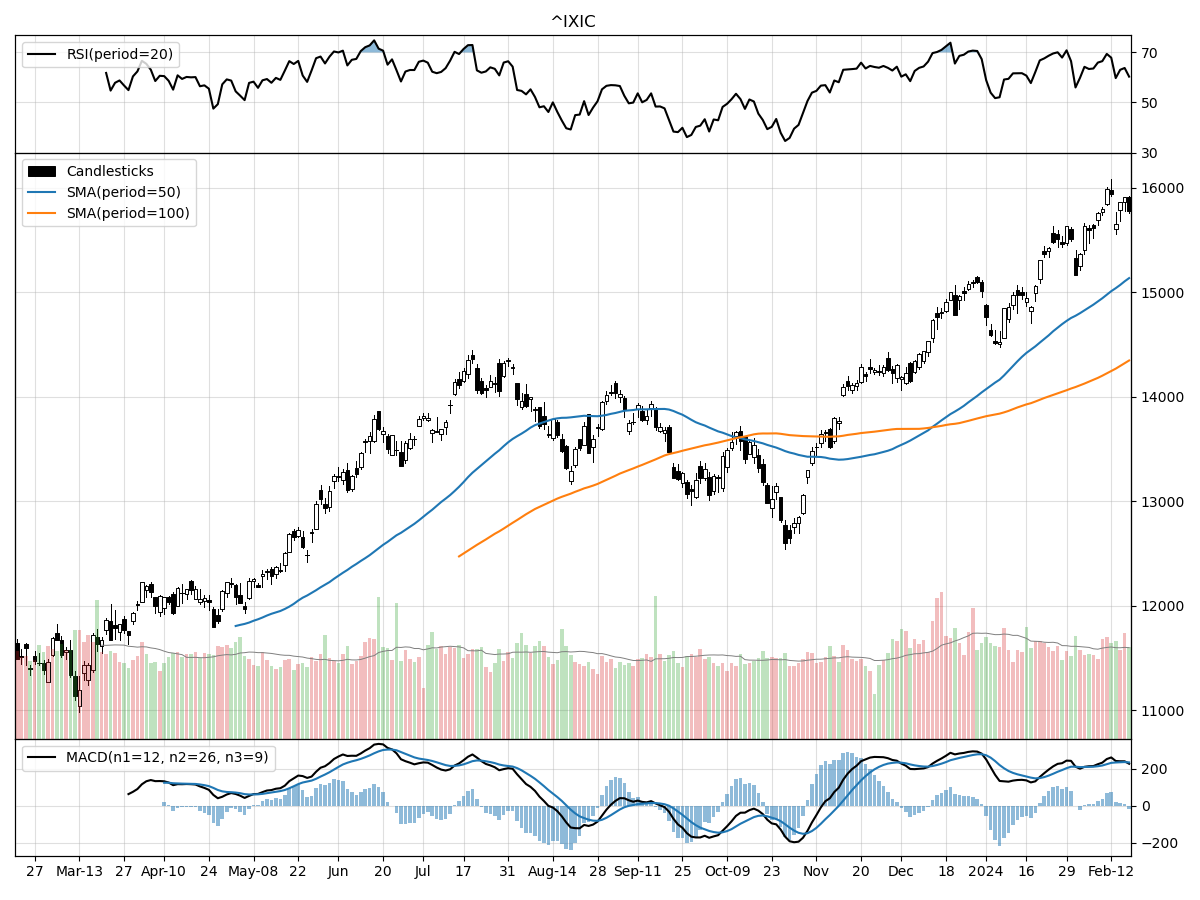
Nasdaq
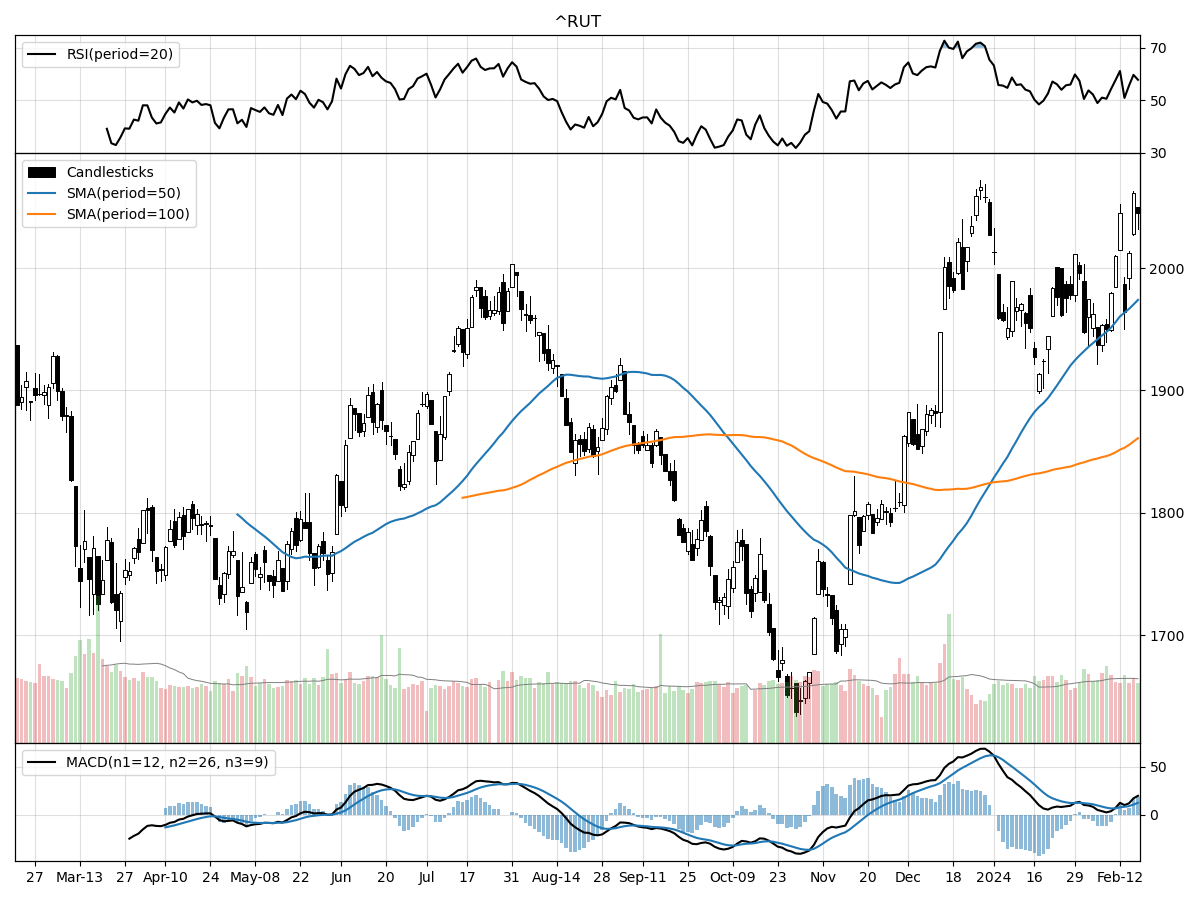
Russell 2000
The technical performances of the S&P 500, Nasdaq, and Russell 2000 indices over the recent term indicate varying degrees of bullish momentum and market participation, each reflecting different aspects of the broader market.
The S&P 500, with a current stock price of 5005.57, has been showing moderate buying pressure as indicated by money flow indicators, and the Moving Average Convergence Divergence (MACD) is bullish at 64.21. The index is modestly overbought according to the Relative Strength Index (RSI), suggesting that there might be a pullback or consolidation in the near term, especially considering it is currently at its 52-week high. The daily trading volume is slightly above its longer-term average, and the index has seen a 10.3% increase over the last three months, indicating a positive trend.
In comparison, the Nasdaq index is also under accumulation, with a bullish MACD of 234.2, which is significantly higher than that of the S&P 500, signaling stronger bullish momentum. The index is 41% above its 52-week low and just 1% below its 52-week high, showcasing a robust recovery. It has risen 11.1% in the past three months. Unlike the S&P 500, the Nasdaq is not considered overbought or oversold, which could imply a more sustainable upward trend. The daily volume is higher than its long-term average, suggesting increased investor interest, particularly in tech stocks, which are heavily represented in the Nasdaq.
The Russell 2000 Small Cap index, often viewed as a gauge for domestic economic health, is also demonstrating a bullish trend but with less overextension compared to the S&P 500. Its MACD at 12.30, while bullish, is less pronounced than that of the other two indices. The Russell 2000 has risen approximately 14.7% over the last three months, the highest of the three indices, without being overbought or oversold. This performance indicates a strong rally in small-cap stocks, which may be seen as a positive sign for market breadth and investor confidence in smaller enterprises. The daily volume is in line with its longer-term average, suggesting consistent participation in this market segment.
In sum, all three indices are showing positive momentum, with the Nasdaq and Russell 2000 demonstrating a potentially more sustainable trend due to the absence of overbought conditions. The S&P 500's overbought status could indicate a near-term risk of pullback, but its stable volume and moderate buying pressure still reflect a positive outlook. The Russell 2000's outperformance in percentage terms and alignment with its average volume point to a broad-based investor confidence in the growth potential of small-cap companies.
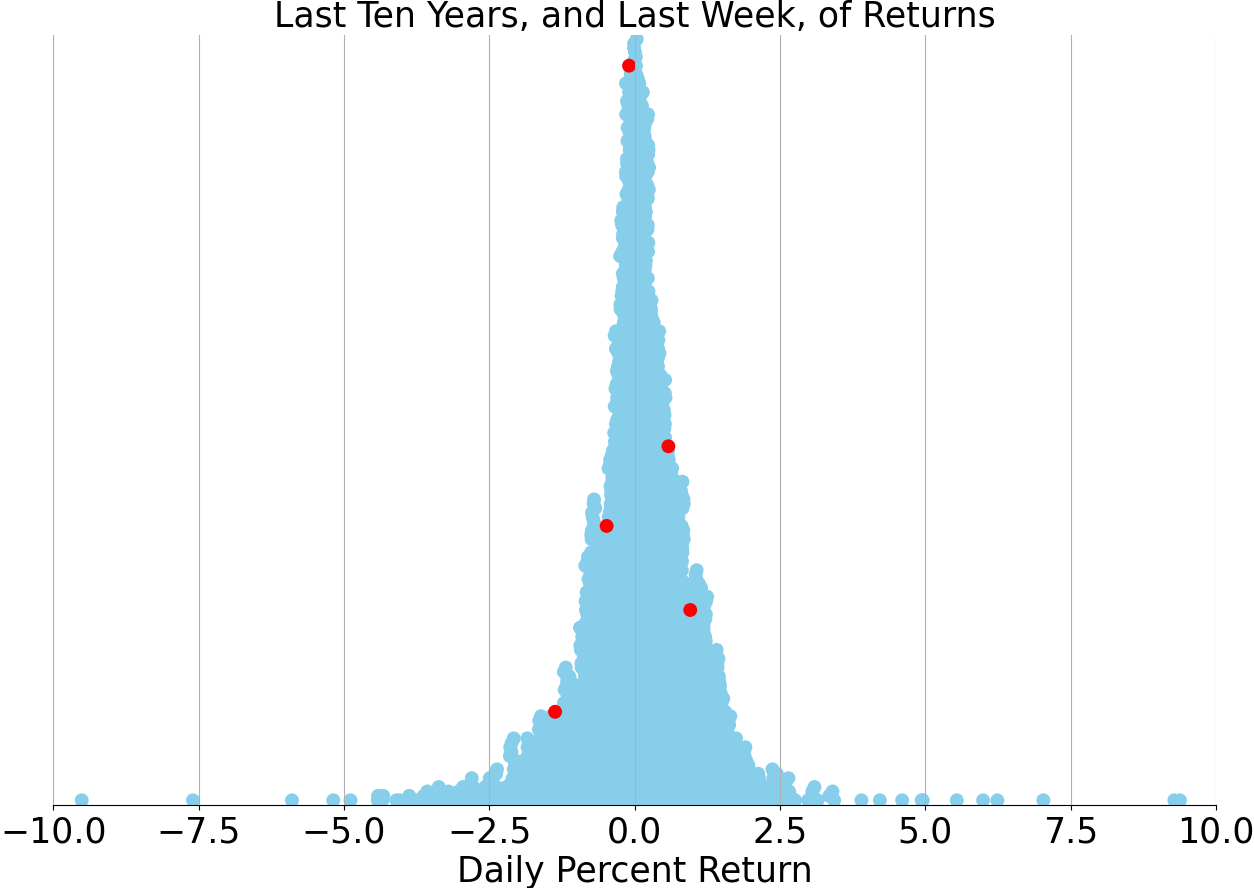
Last week vs. history (Large Cap S&P 500)
Market Commentary
Inflation Data Rattles, But Future Rate Cuts in Sight
In the latest economic updates, inflation continues to be a focal point for investors and policymakers alike. The Consumer Price Index (CPI) and Producer Price Index (PPI) reports for January provided a mixed bag of results, with the CPI climbing to 3.1% year-over-year, a notch above the anticipated 2.9%, although still beneath December's 3.4% mark. Core inflation, which strips out volatile food and energy prices, held firm at 3.9% year-over-year, aligning with December's figures and surpassing expectations of 3.7%. These readings suggest that while inflationary pressures persist, the broader trend may not necessarily indicate a long-term rise in prices.
Delving deeper into the CPI data, a divergence in trends emerged. Energy costs and used vehicle prices showed signs of cooling, while food, dining out, and motor vehicle insurance expenses inched upwards. The most stubbornly high category was housing costs, with rent and shelter prices—accounting for one-third of the CPI basket—rising by a significant 6% annually. This is particularly noteworthy as these figures tend to lag real-time market conditions, hinting at a potential future deceleration in this inflation component.
The PPI data echoed this sentiment with headline PPI at 0.9% year-over-year, higher than the forecasted 0.6% but down from December's 1%. Core PPI also exceeded expectations, suggesting that producer prices remain under pressure. However, the overall trend is down from the highs seen in 2022, signaling a possible easing of inflationary pressures in the production sector.
The "January effect," a phenomenon where prices often increase at the start of the year, may have contributed to the inflation figures, possibly overstating the persistence of inflation. This effect, coupled with a robust economy and strong consumer spending, especially in services such as travel and dining, could keep inflationary concerns alive. Yet, there are early indicators of a slowdown. January's retail sales dipped by 0.8% month-over-month, more than the anticipated 0.15% decline, suggesting a potential shift in consumer behavior.
The labor market, while still robust, shows signs of cooling. A rise in the unemployment rate to 4.1% from the current 3.7% is projected by the Fed, with job openings and quits rates both trending downward. This could lead to a moderation in wage growth and, consequently, a tempering of services inflation.
Market expectations for Federal Reserve rate cuts have been recalibrated in light of the recent inflation data. Whereas five rate cuts were previously anticipated to start as early as May, expectations have now been pared back to around four cuts, possibly beginning in June. This adjustment aligns more closely with the Fed's cautious stance and our outlook for a gradual commencement of rate cuts in mid-2024.
Despite the initial jolt from the inflation data, markets have shown resilience, with equities stabilizing and yields reflecting a more measured outlook for rate adjustments. While volatility may persist as inflation trends evolve, the current economic backdrop does not suggest a turn towards a bear market. Investors may find opportunities to diversify and strengthen their portfolios in anticipation of a potential multiyear cycle of Fed rate reductions.
In conclusion, the recent inflation data has prompted a reassessment of the economic landscape, with a focus on the interplay between consumer behavior, labor market dynamics, and policy responses. As we move forward, the moderation in inflation, coupled with strategic rate cuts by the Fed, may pave the way for sustained market growth and investment opportunities.
AI stock picks for the week (Large Cap S&P 500)


