
The Monday Charge: February 12, 2024
In a remarkable display of market resilience, the S&P 500 has surged past the 5,000 mark, setting a new benchmark and underscoring investor confidence amid an aggressive rate-hiking cycle by the Federal Reserve.

This is our Monday article, focusing on the large cap S&P 500 index. Just the information you need to start your investing week. As always, 100% generated by AI and Data Science, informed, objective, unbiased, and data-driven.
First off, check out our new Sector AI content, updated weekly, here!

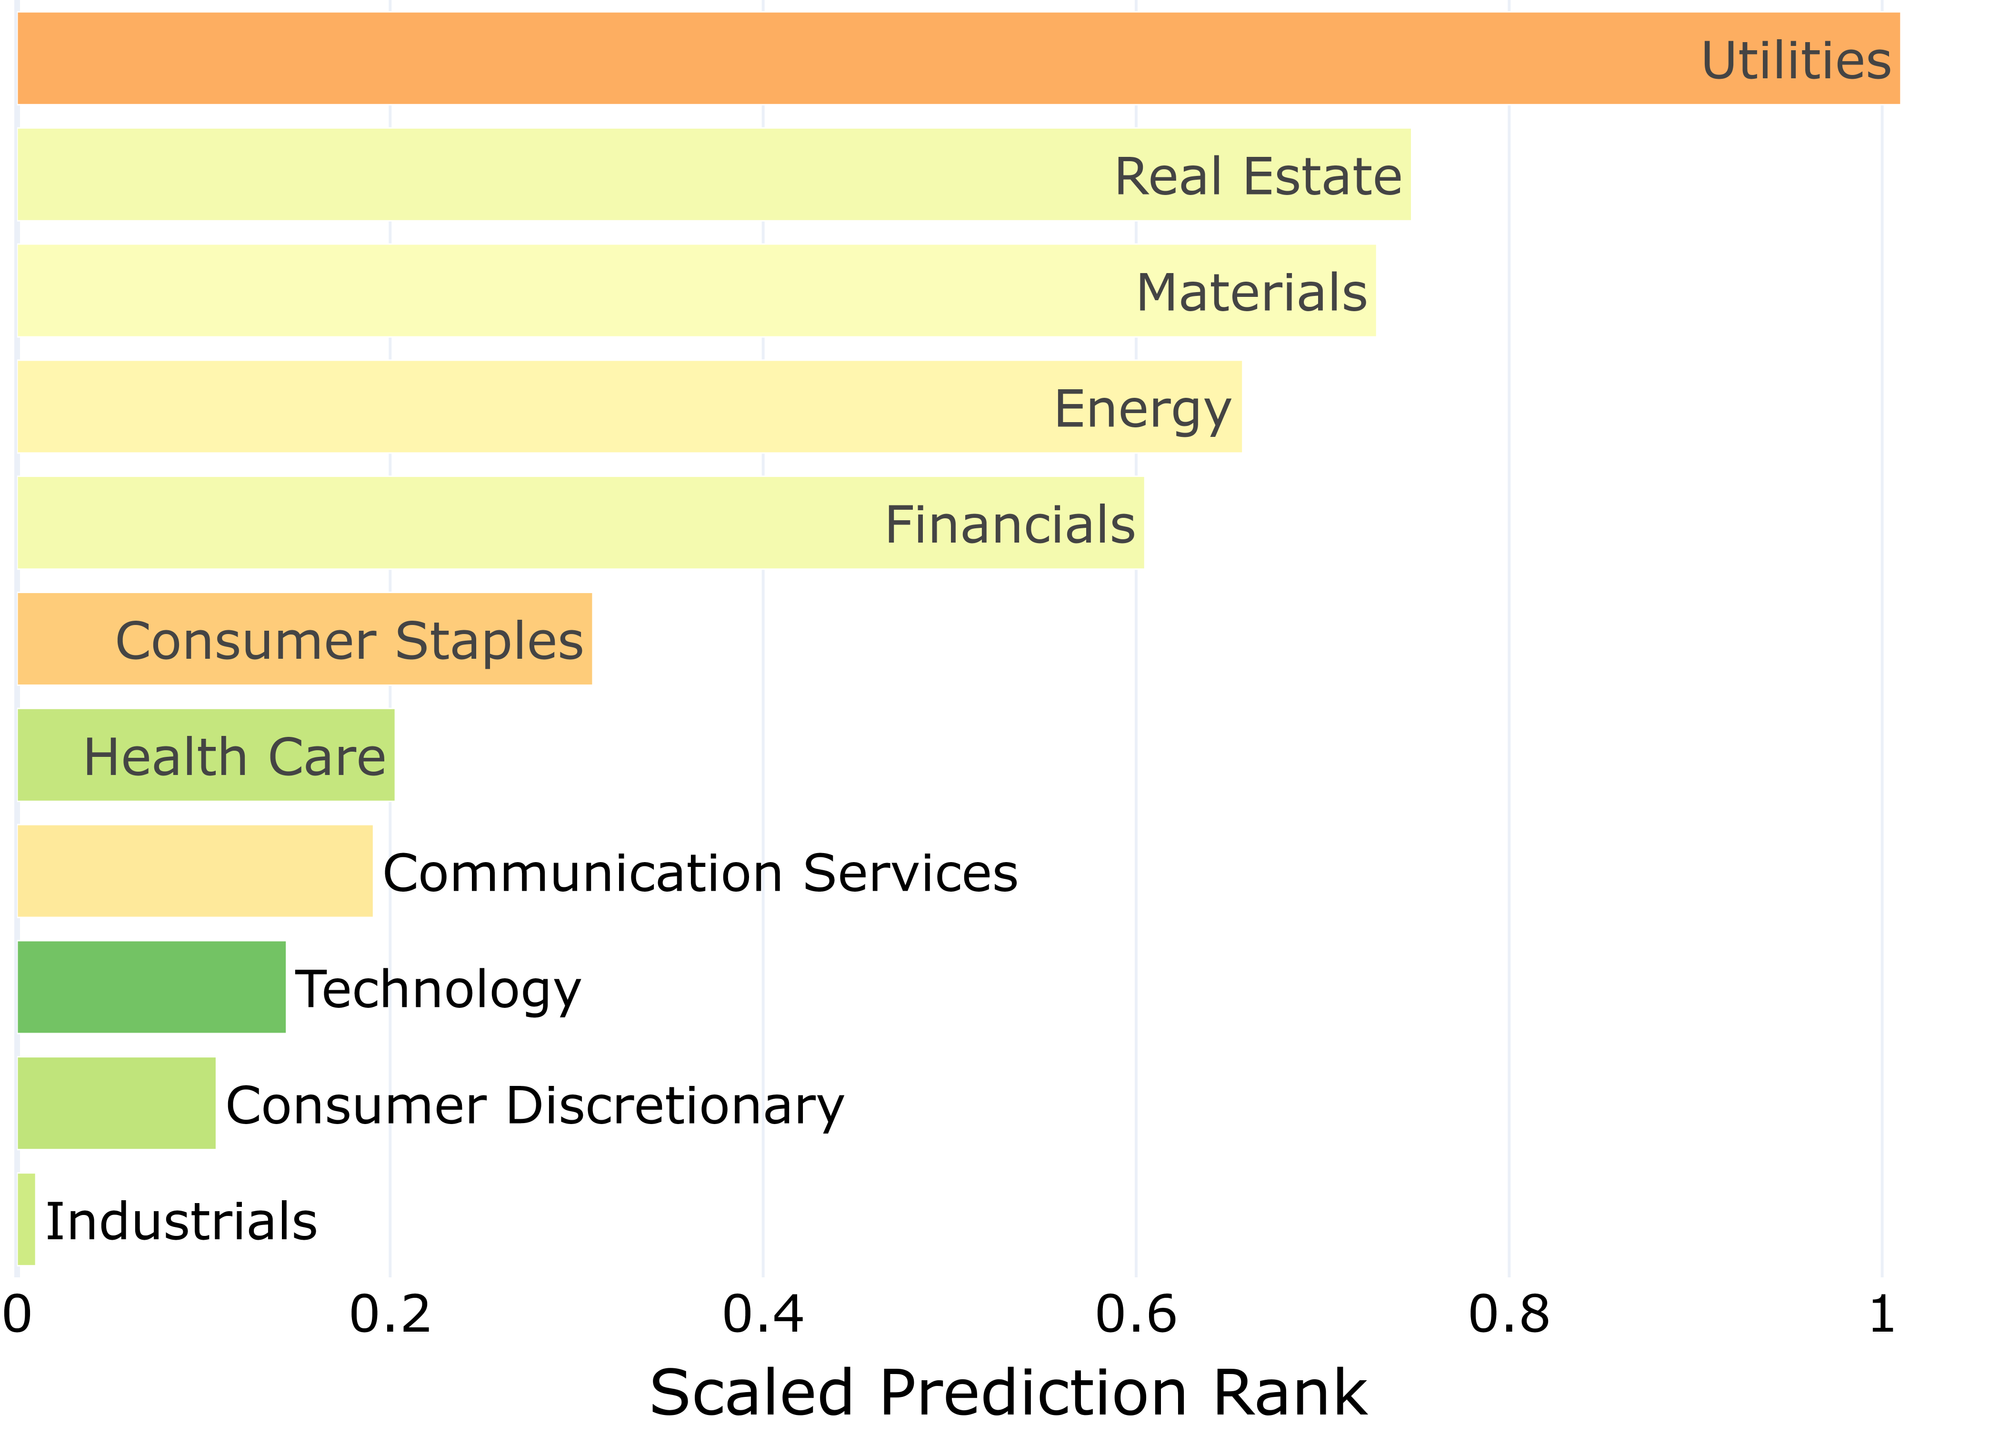
AI stock picks for the week (Large Cap S&P 500)
(Scroll to the bottom now)
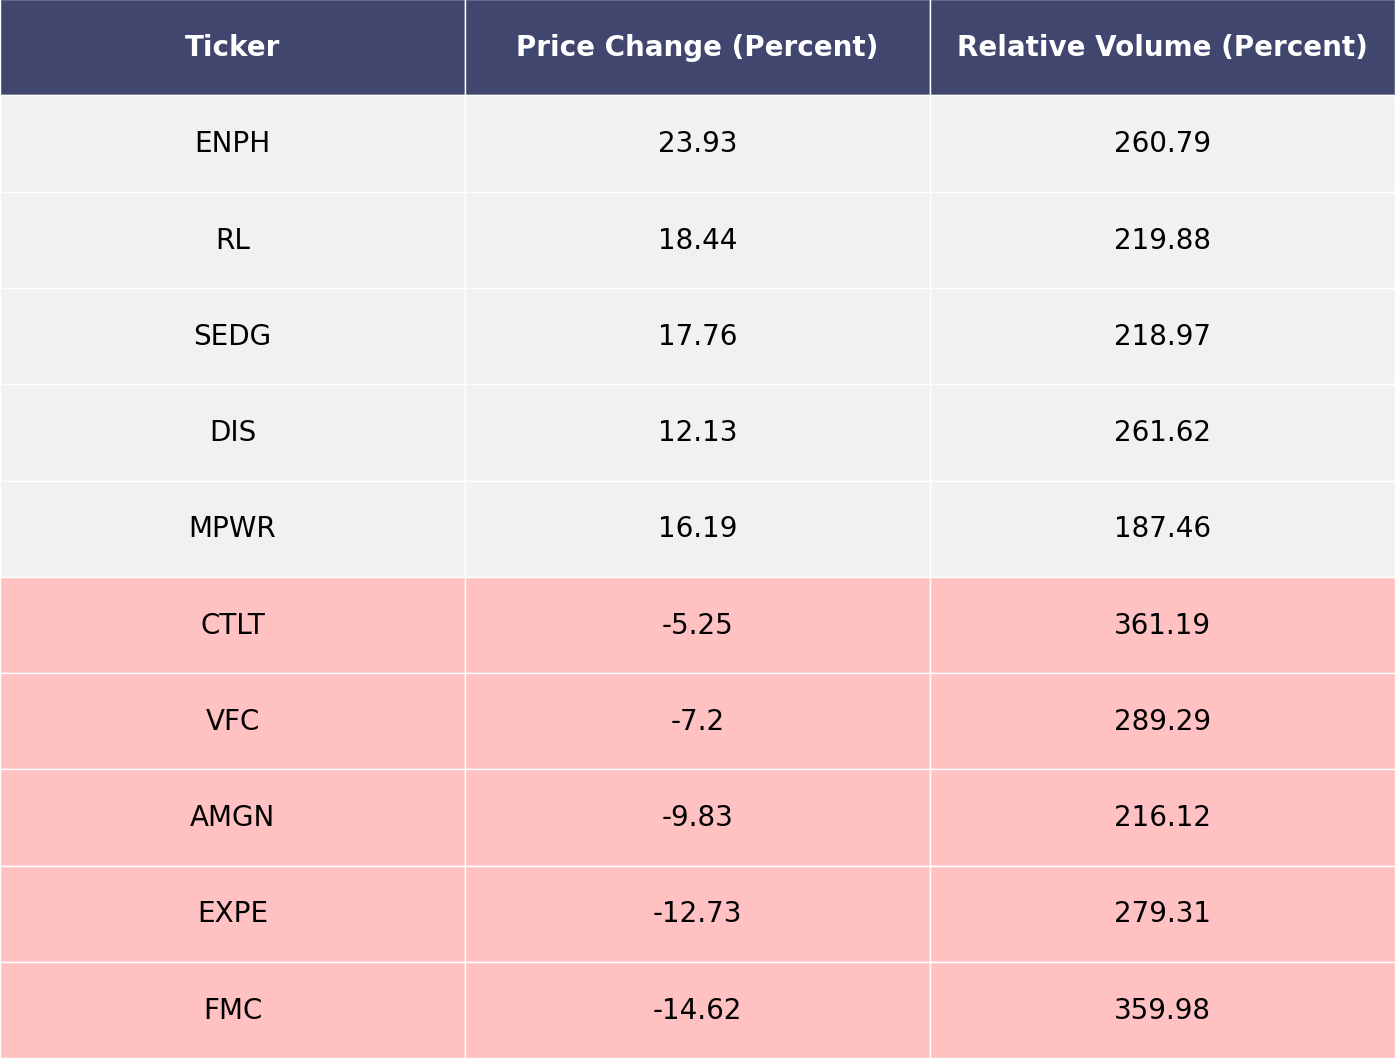
The biggest movers last week on price and volume (Large Cap S&P 500)
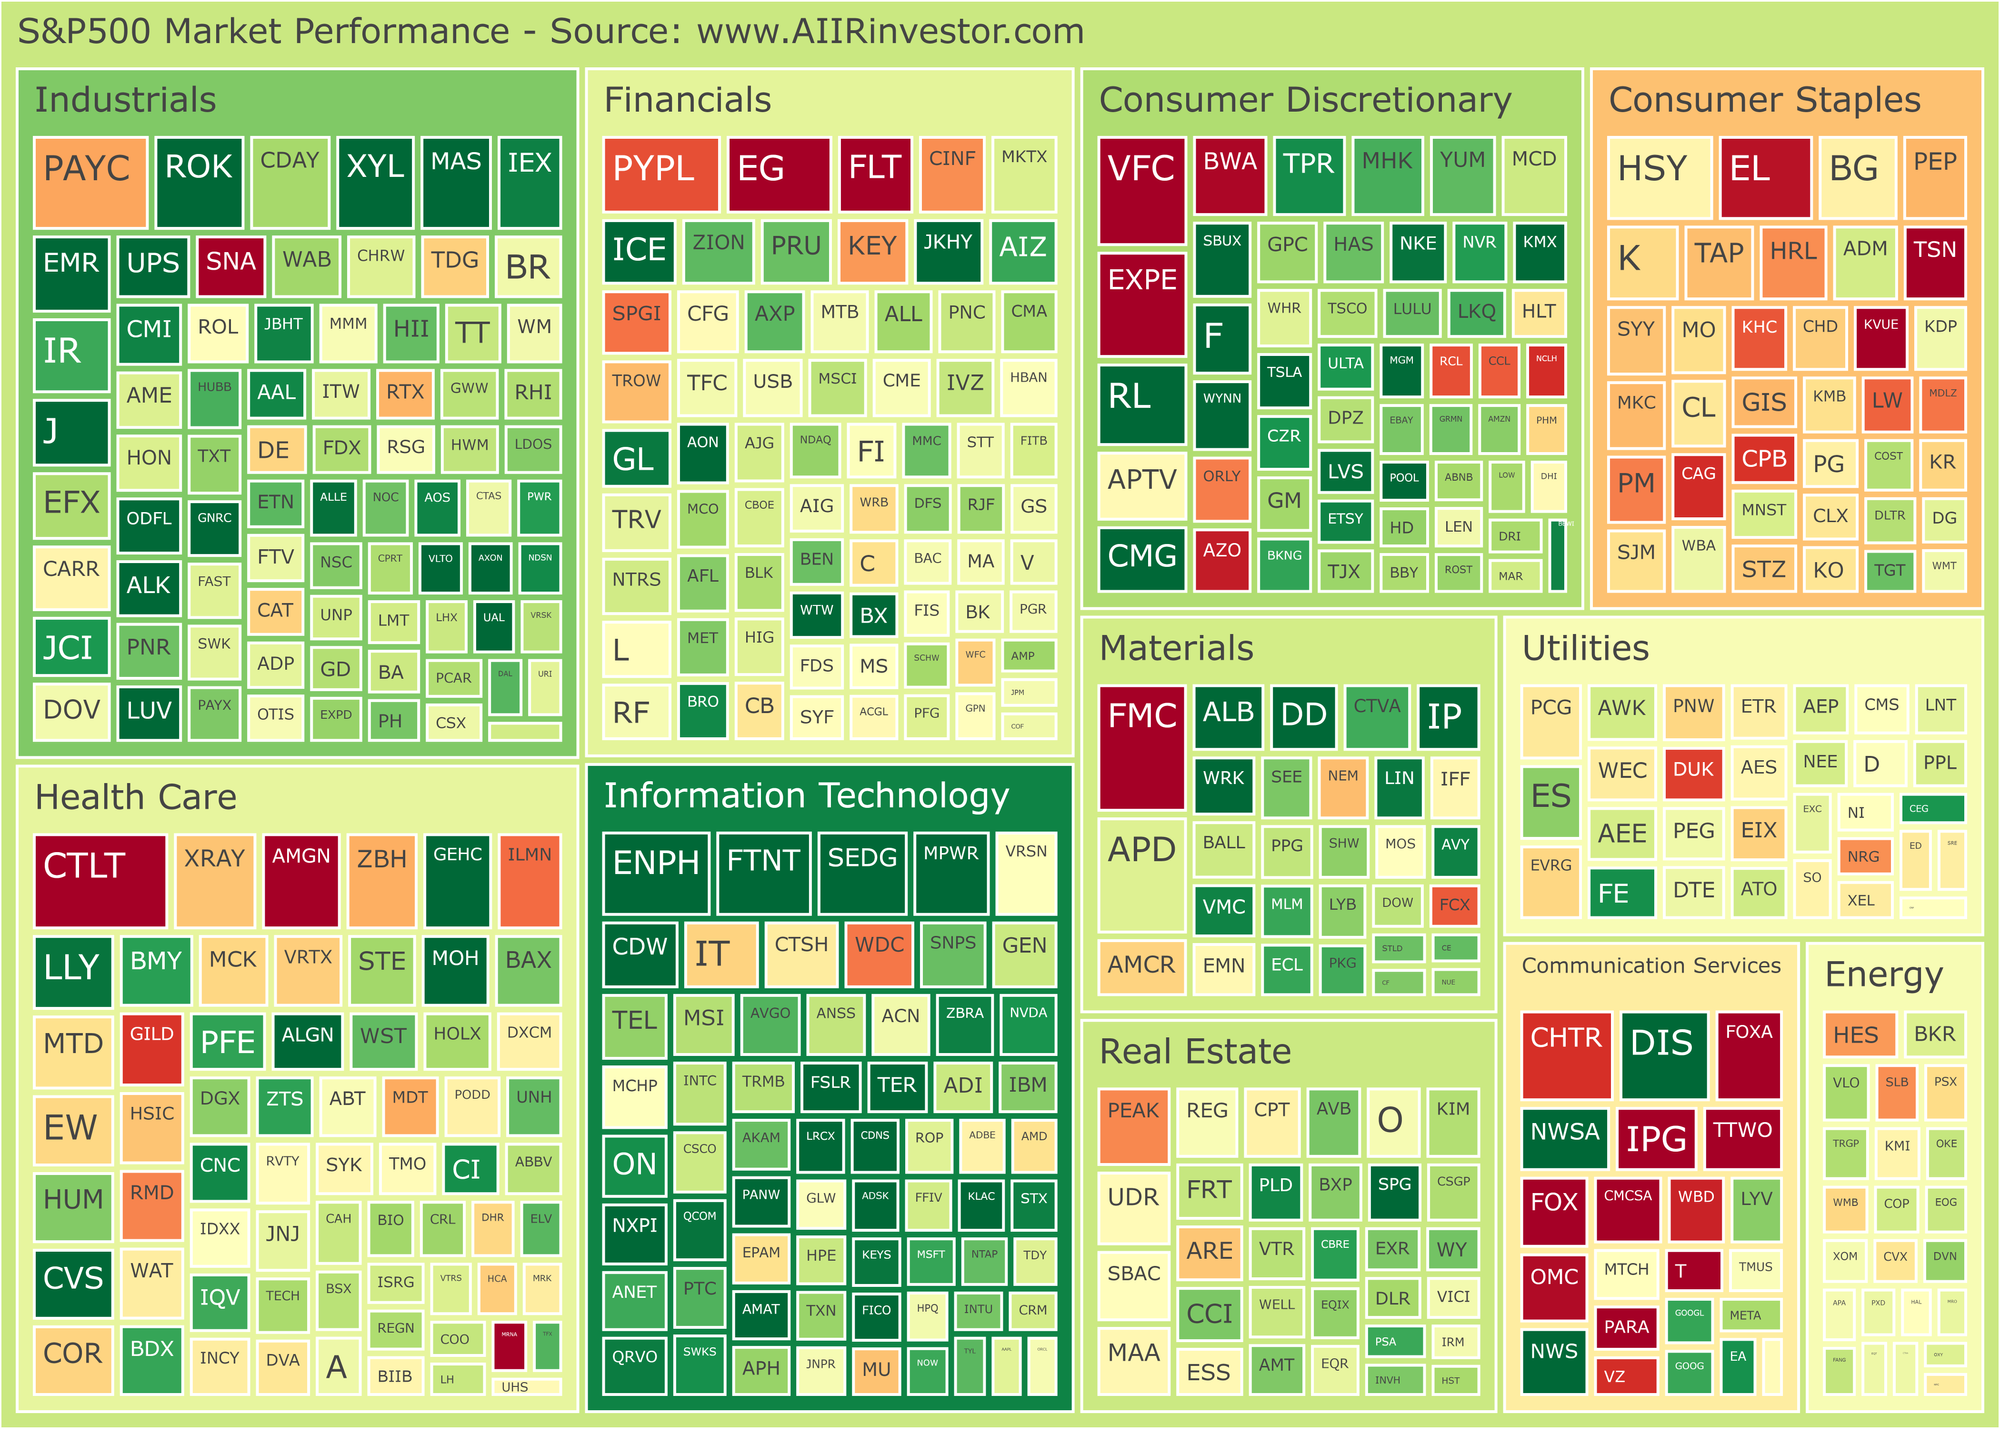
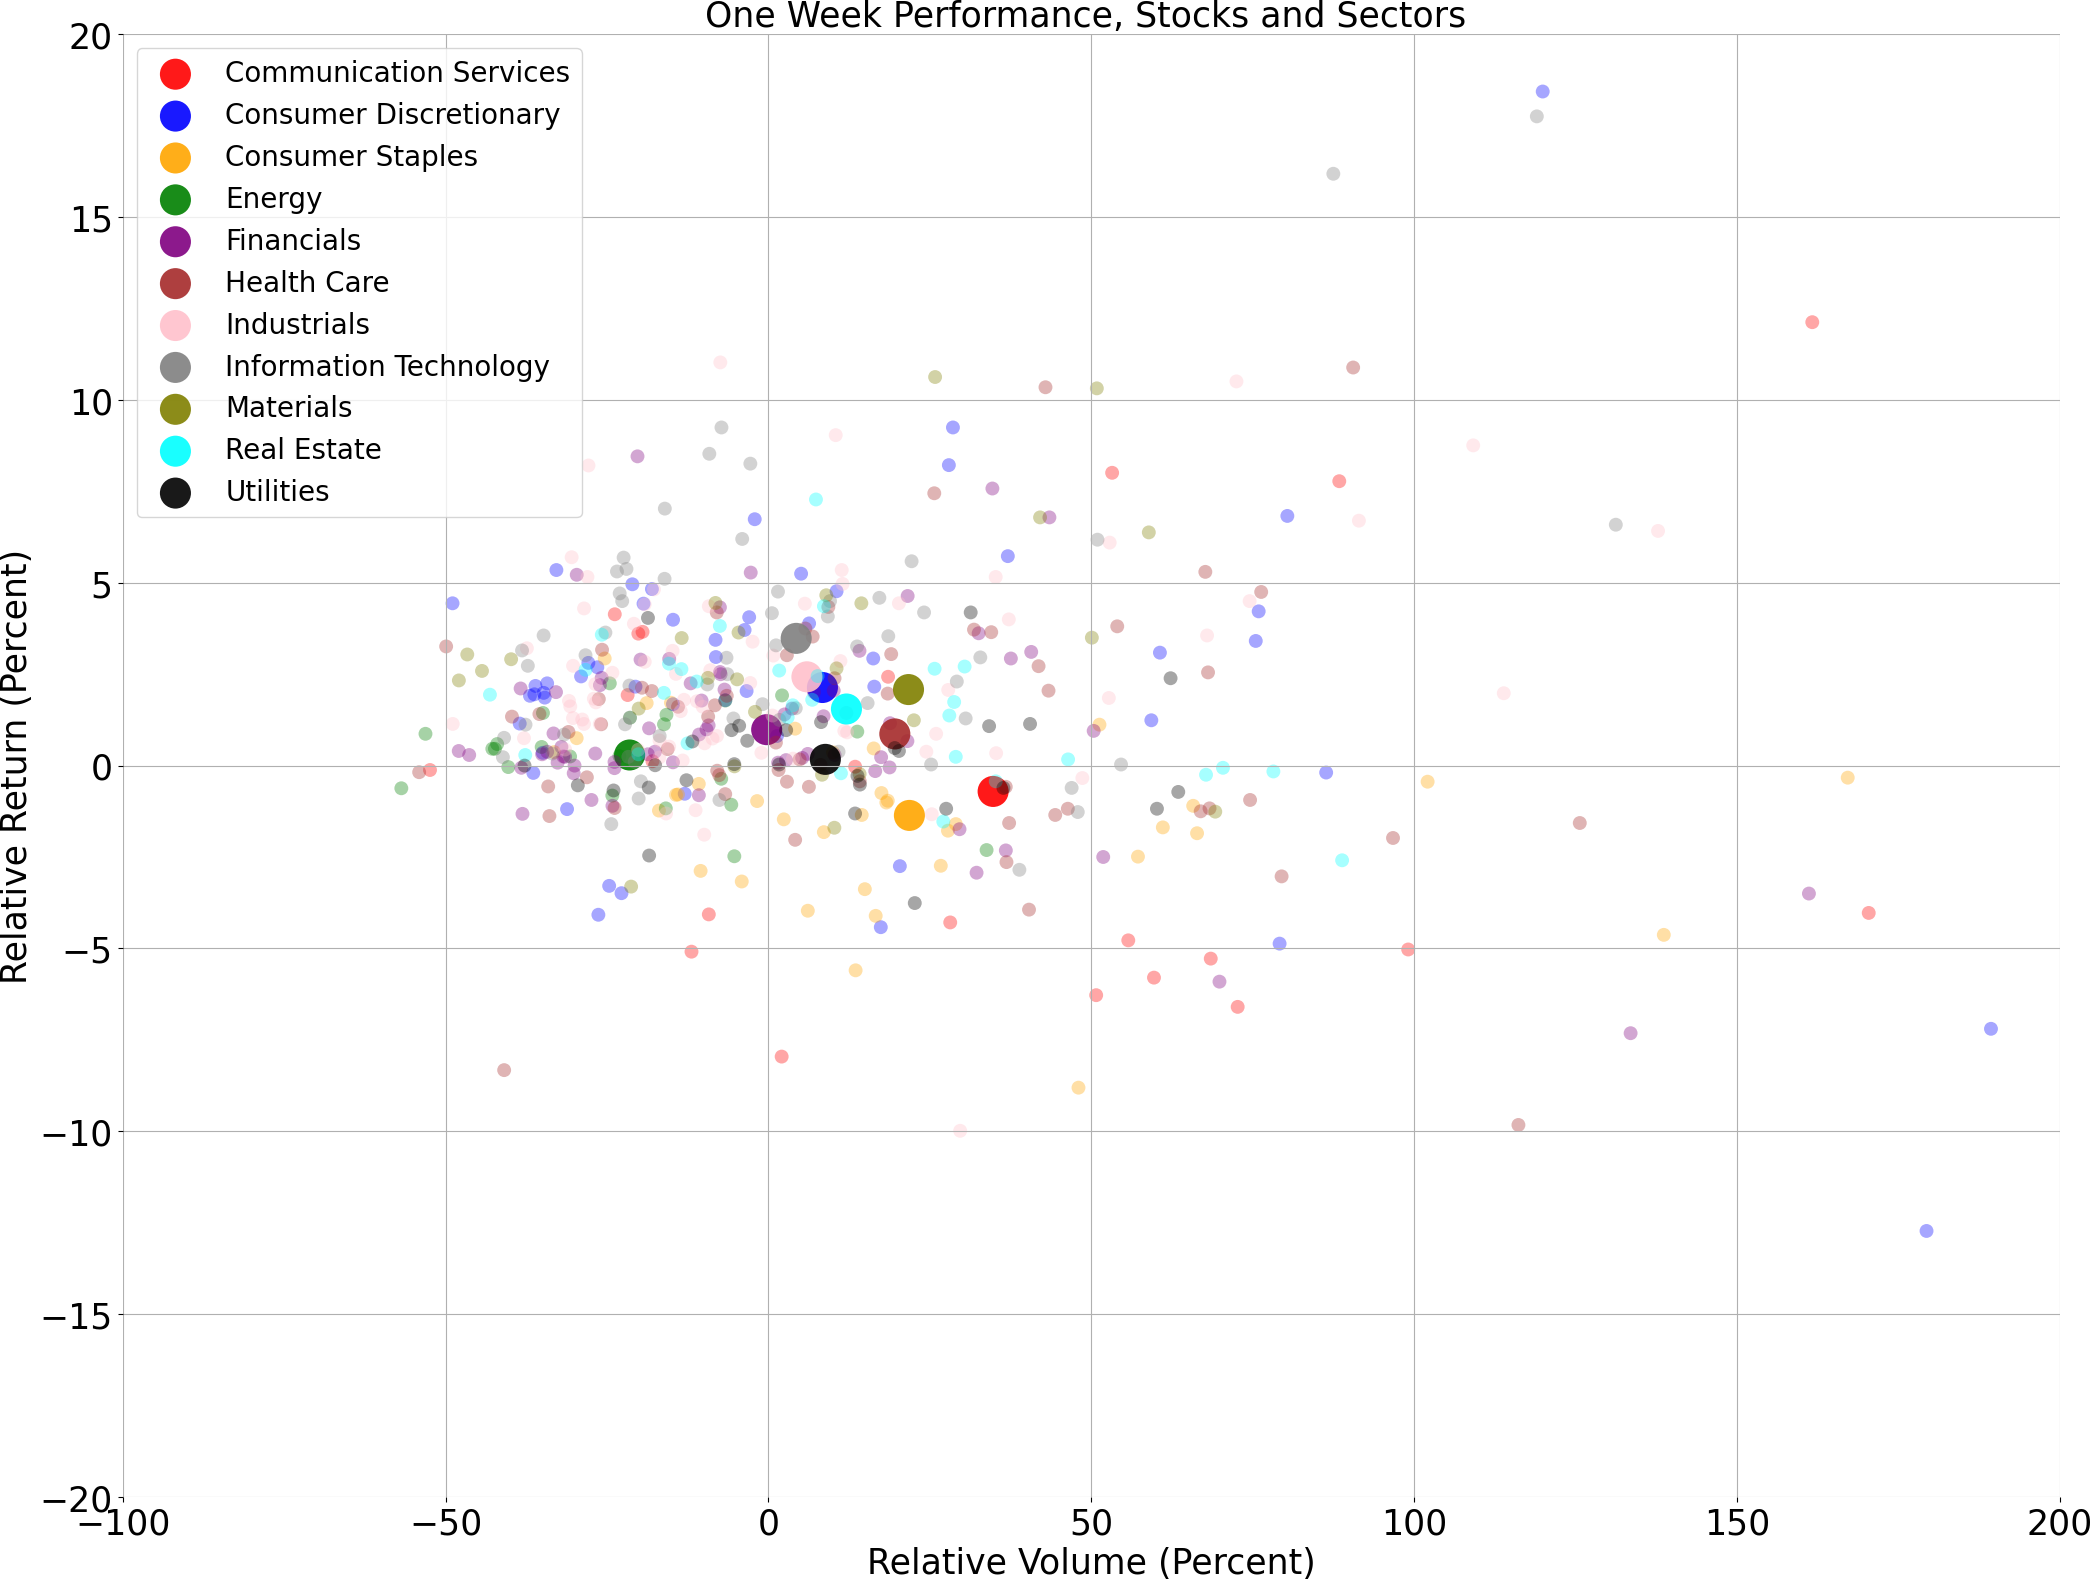
Price and volume moves last week for every stock and sector (Large Cap S&P 500)
A technical analysis across indices
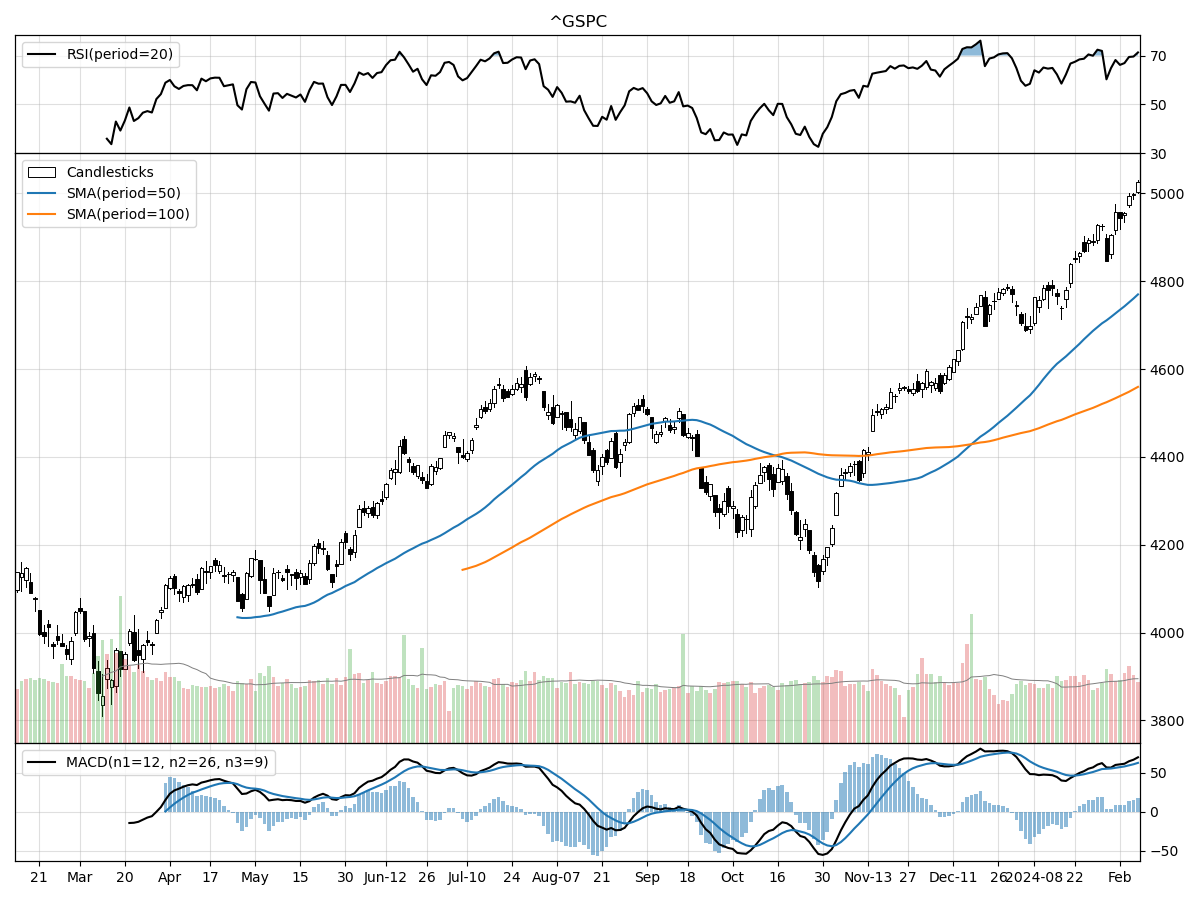
S&P500
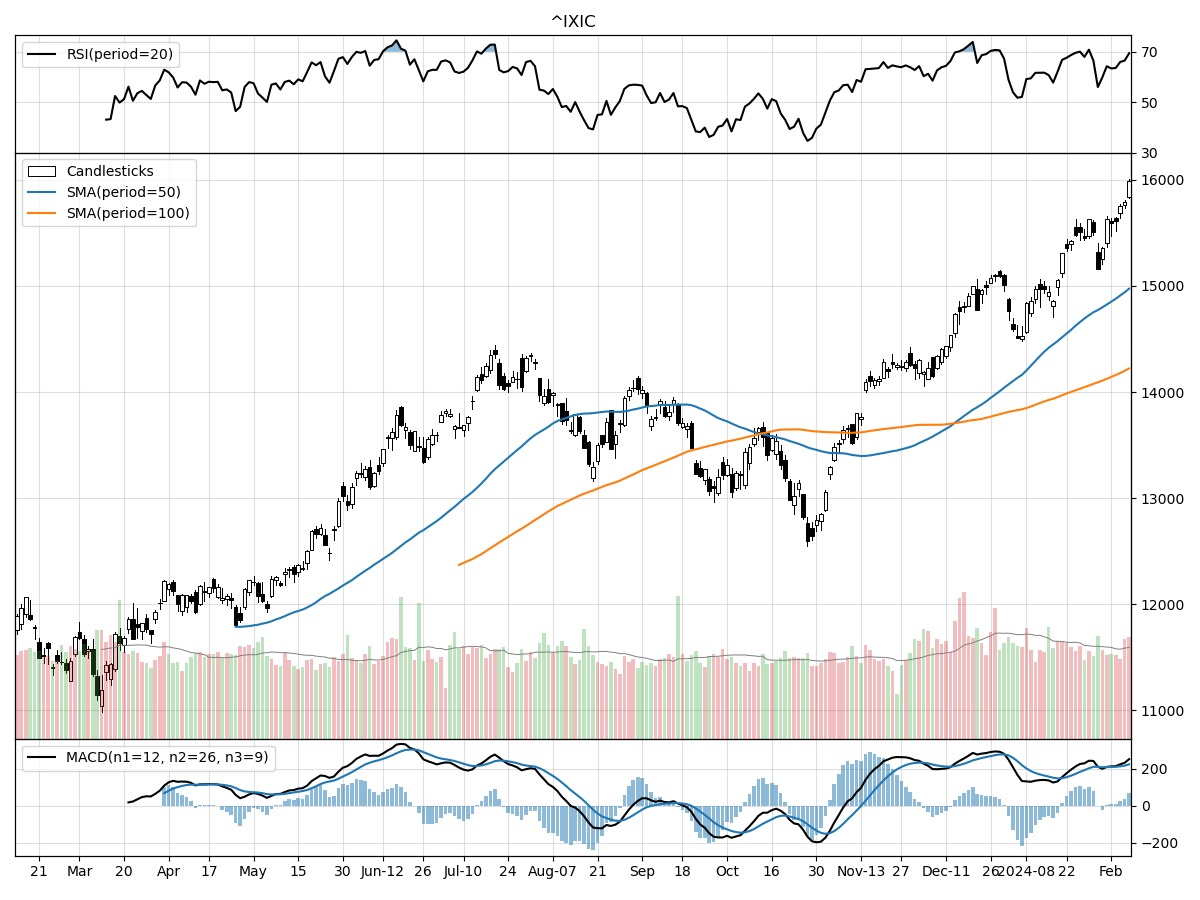
Nasdaq
Russell 2000
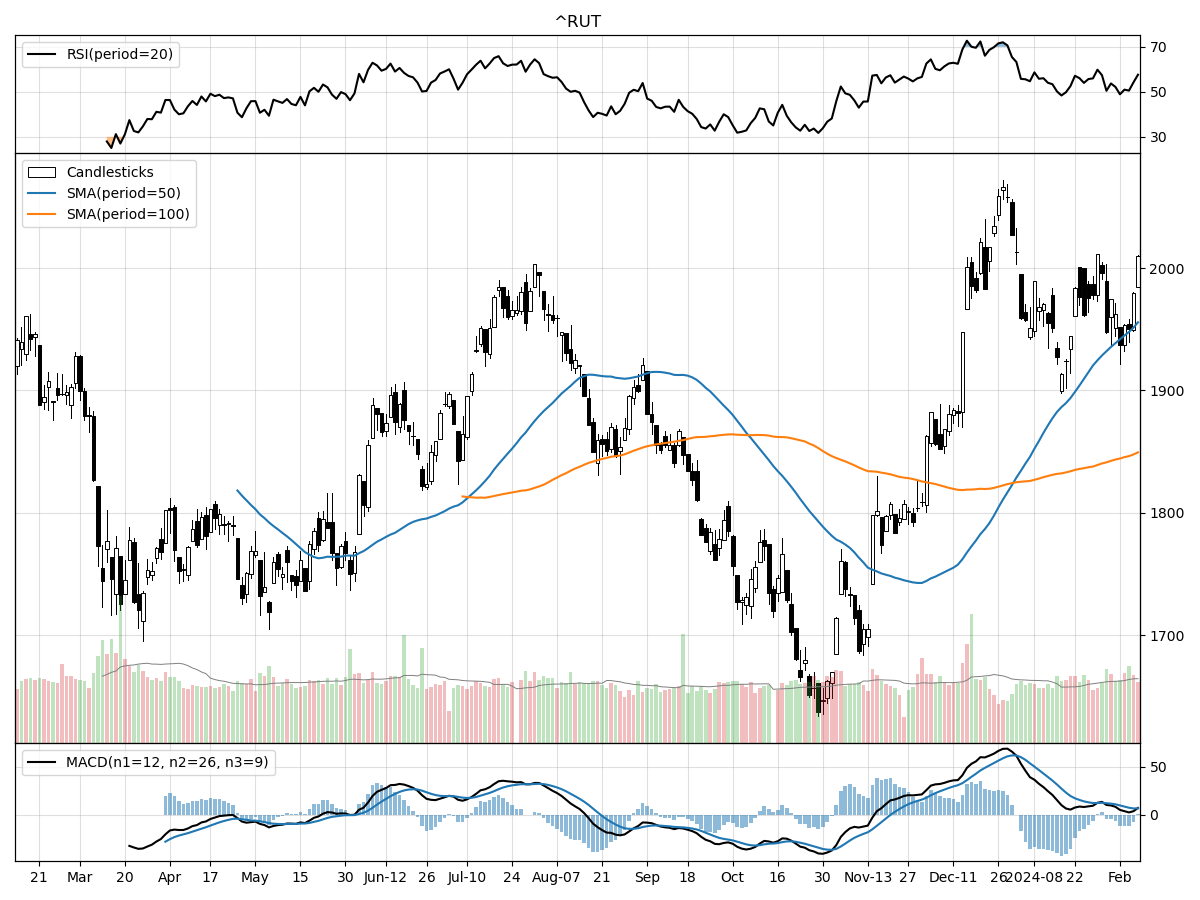
When comparing the technical performance across the S&P 500, Nasdaq, and Russell 2000 Small Cap indices, several key distinctions stand out. The S&P 500 is trading at 5026.61, which is at its 52-week high and 30% above its 52-week low, indicating a robust uptrend. The Nasdaq, while also showing strength, is currently at 15990.66, 43% above its 52-week low, and right at its peak, suggesting it has been outperforming the S&P 500 in terms of recovery from lows. The Russell 2000 is trading at 2009.99, which is 22% above its 52-week low and 2% below its high, indicating a slightly more tempered growth trajectory compared to the larger indices. This suggests that small-cap stocks, as a whole, may not have experienced the same level of bullish sentiment as their larger counterparts in the current market.
Volume trends reveal that all three indices are experiencing daily trading volumes higher than their longer-term averages, which can be a sign of increased investor interest and market activity. However, the Nasdaq stands out with a significantly higher recent daily volume compared to its longer-term average, possibly indicating greater investor confidence or speculative activity within the tech-heavy index. The S&P 500 and Russell 2000 are also seeing higher than average volumes, albeit to a lesser extent.
In terms of technical indicators, the S&P 500 and Nasdaq indices appear overbought according to their respective Relative Strength Index (RSI) readings. This could suggest a potential for a pullback or consolidation in the near term, as markets typically revert after extended periods of overbuying. Both are also seeing heavy buying pressure and accumulation according to Money Flow indicators, with bullish Moving Average Convergence Divergence (MACD) readings of 62.43 and 224.4, respectively, further supporting the notion of a strong bullish trend. The Russell 2000's indicators are more balanced, with the RSI not indicating an overbought condition, and a bullish but less extreme MACD of 6.529; this suggests that while there is positive momentum, it may not be as overheated as with the larger indices. Overall, while all three indices are trending upwards, the S&P 500 and Nasdaq appear to be at more speculative stages than the Russell 2000, which could be seen as having a more stable, albeit slower, growth pattern.
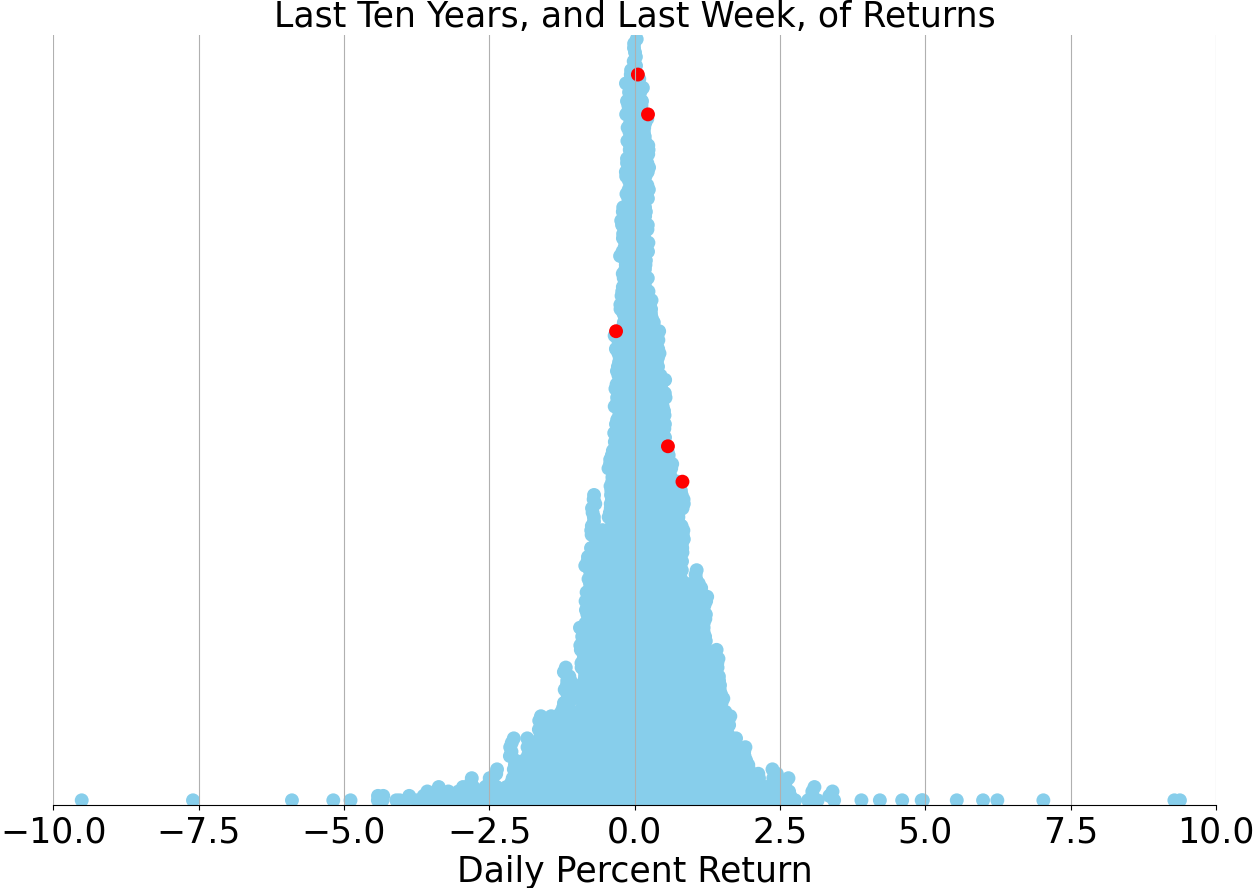
Last week vs. history (Large Cap S&P 500)
Market Commentary
In a remarkable display of market resilience, the S&P 500 has surged past the 5,000 mark, setting a new benchmark and underscoring investor confidence amid an aggressive rate-hiking cycle by the Federal Reserve. This milestone, though largely symbolic, reflects the market's ability to withstand economic headwinds and suggests a robust underlying strength. The climb to 5,000 comes against the backdrop of a year filled with recessionary fears which have since subsided, as evidenced by the decline in recession-related internet searches—a testament to the market's buoyant mood.
Despite higher borrowing costs and a spike in inflation last year, the U.S. consumer has continued to fuel economic growth through sustained spending, particularly in discretionary sectors. This consumer resilience is underpinned by pandemic-era savings, a tight labor market, and historically low mortgage rates. However, there are emerging signs of consumer fatigue, as seen in the slowing growth of consumer credit and the rise in card delinquencies. These indicators suggest a potential moderation in growth ahead, though the overall health of household finances remains stable, providing a cushion against economic downturns.
The Fed's rate hikes have undoubtedly cooled certain sectors, especially housing and manufacturing, which are sensitive to interest rate fluctuations. Yet, recent data indicates a potential rebound, with mortgage rates retreating from their peak and manufacturing orders outpacing inventories, hinting at an upcoming acceleration in activity. This suggests that the economic contraction may be giving way to a rekindling of growth as Fed policies become less restrictive.
The possibility of a hard landing or a recession seems to be diminishing, with the economy steering clear of worst-case scenarios. Recent surveys show a decrease in the tightening of credit conditions, hinting at a potential bottoming out of the credit cycle. While consumer spending is expected to decelerate, other sectors may see renewed vigor later in the year, balancing out the slowdown. Moreover, the moderation in labor costs indicates that the Fed may not need to induce a significant economic deceleration to meet inflation targets.
The market's performance last year was dominated by a select group of tech giants, driven by excitement around artificial intelligence (AI). However, there are signs that market leadership is broadening, with sectors like industrials and financials showing signs of strength. A shift in investor focus towards cyclical and value investments is anticipated, particularly if the Fed reduces rates for favorable reasons, such as inflation improvement.
Historically, soft landings following a Fed tightening cycle have been rare, but not unprecedented. The conclusion of tightening has previously catalyzed strong returns across stocks and bonds, with mid-caps often leading the charge. As manufacturing activity shows signs of recovery, small-caps and cyclical sectors like industrials and discretionary could be poised for outperformance, while financials and energy may surge once manufacturing fully rebounds.
Finally, international equities present an intriguing opportunity, with certain markets reaching new highs, while others, like China, face challenges. Despite the discount in international markets compared to U.S. equities, slower growth and earnings momentum warrant caution. Investors are advised to maintain their strategic allocations and watch for signs of global growth acceleration before fully embracing international stocks. As the market landscape evolves, investors remain attuned to the delicate balance between economic indicators and market performance, with an eye on diversification and strategic positioning.
AI stock picks for the week (Large Cap S&P 500)


