
The Monday Charge: August 19, 2024
In a welcome turn of events, recent data has shown that inflation is finally cooling after a series of hotter-than-expected readings earlier this year.

The biggest movers last week on price and volume (Large Cap S&P 500)
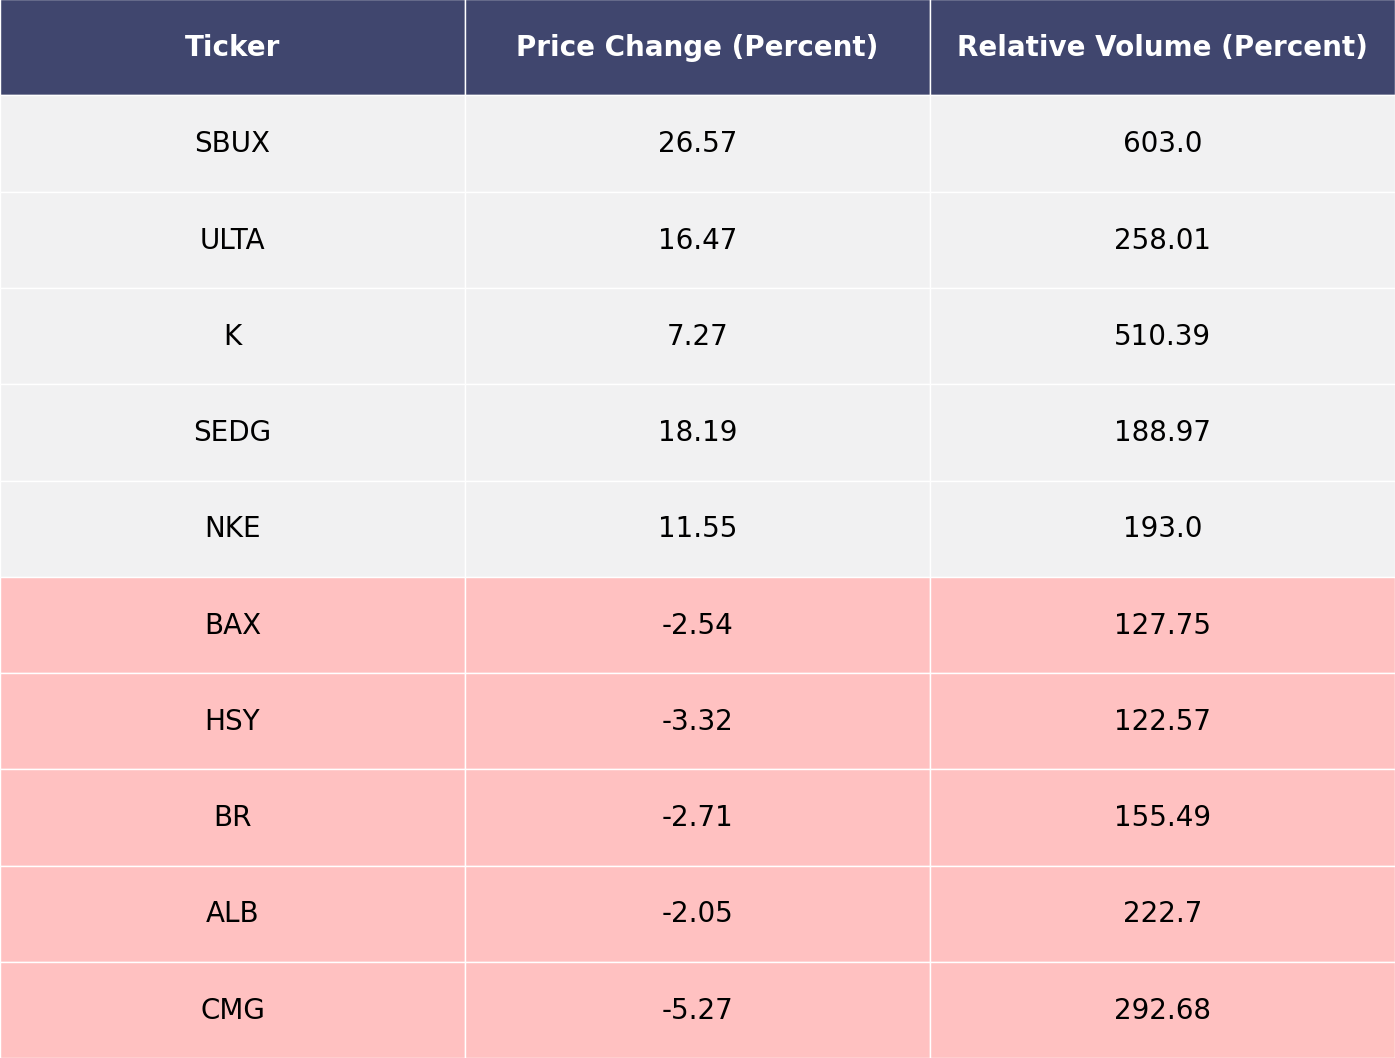
Price and volume moves last week for every stock and sector (Large Cap S&P 500)

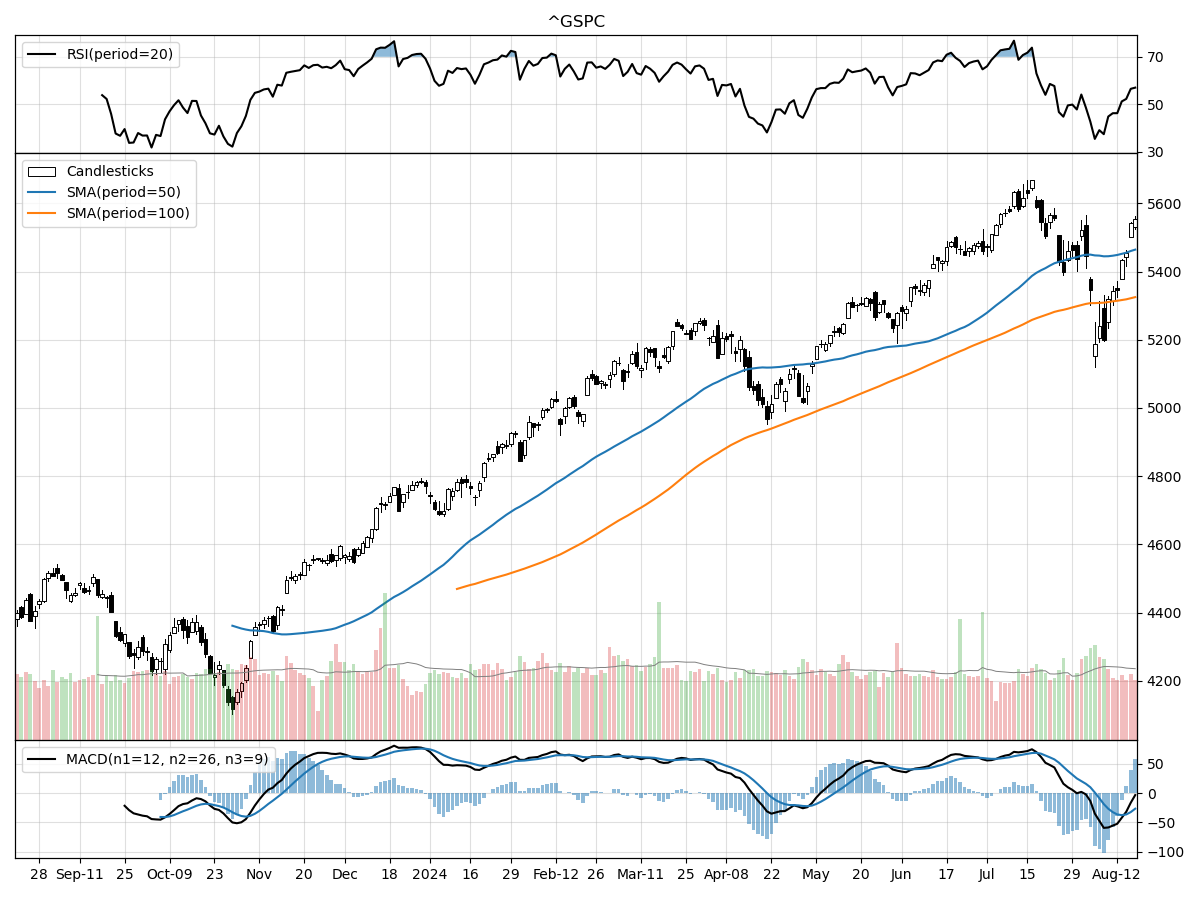
A technical analysis across indices
S&P500
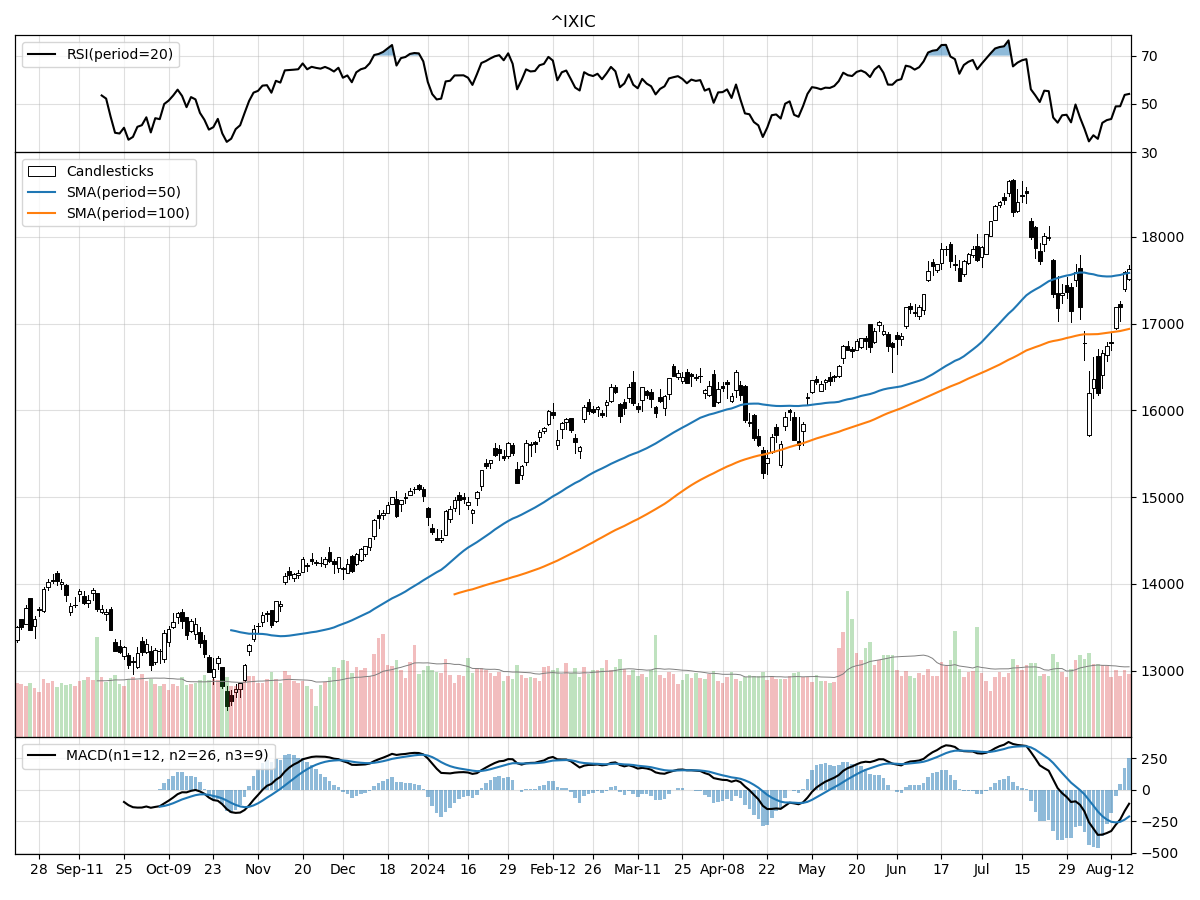
Nasdaq
Russell 2000
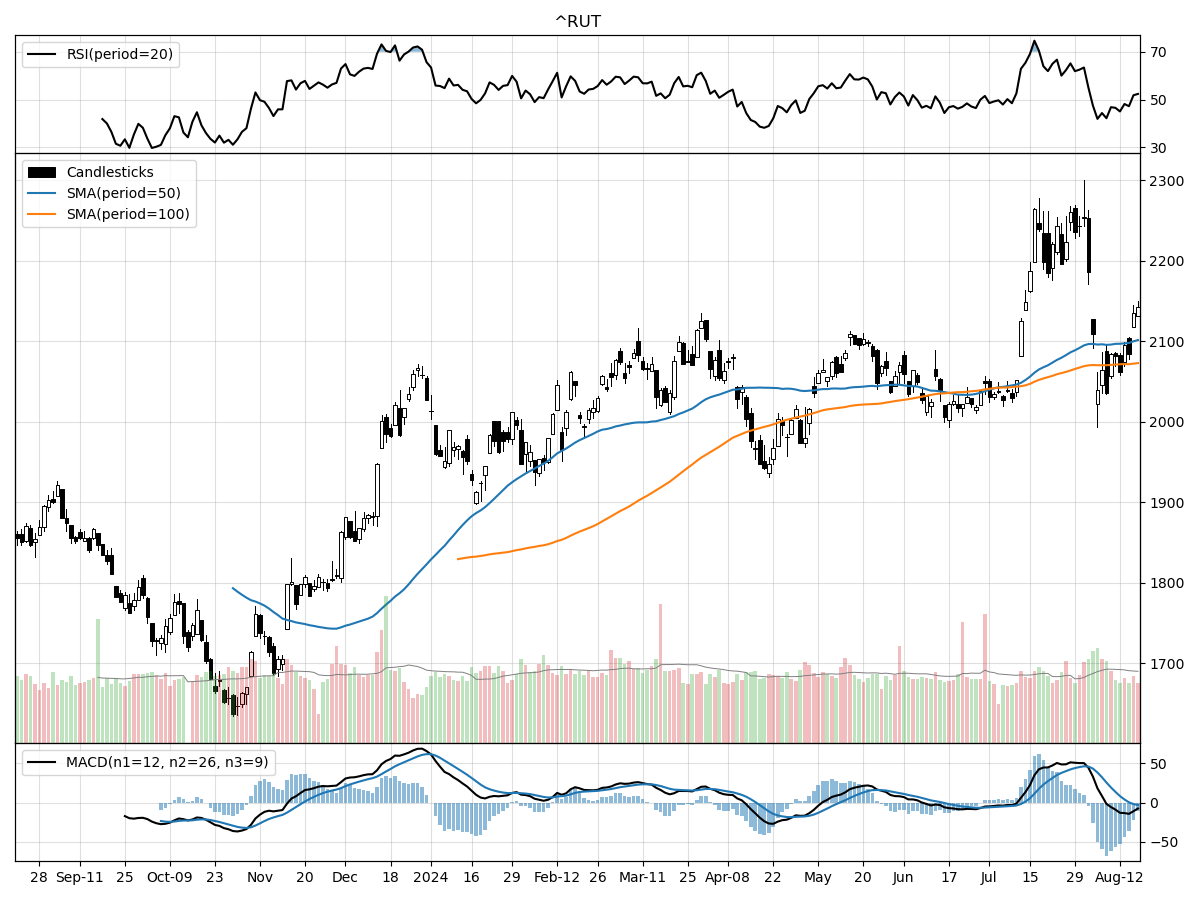
In comparing the technical performances of the S&P 500, Nasdaq, and Russell 2000 indices, several key trends and divergences emerge. All three indices have remained relatively stable over the past month and quarter, suggesting a period of consolidation. However, the S&P 500 is just 1% below its 52-week high, indicating a strong recent performance relative to its historical context. The Nasdaq, despite being 5% below its 52-week high, boasts a notable 39% increase from its 52-week low, suggesting robust recovery momentum. Similarly, the Russell 2000 is 5% below its 52-week high while being 30% above its 52-week low, highlighting a steady, albeit less dramatic, upward trend compared to the Nasdaq.
When it comes to volume and money flow, the Nasdaq stands out with significantly higher daily trading volume compared to its historical average, indicating heightened investor interest. This is in contrast to the S&P 500 and Russell 2000, where trading volumes are closer to their longer-term averages. Money flow indicators reveal that the S&P 500 and Russell 2000 are under distribution, suggesting selling pressure and potential caution among investors. In contrast, the Nasdaq is under accumulation, signaling buying interest and positive sentiment toward tech-heavy stocks.
From a momentum perspective, all three indices display bearish MACD values, indicating potential downward pressure in the near term. The S&P 500 has the least negative MACD at -26.6, followed by the Russell 2000 at -3.14, and the Nasdaq with the most pronounced bearish signal at -212. This suggests that while all three indices face some headwinds, the Nasdaq might experience more significant short-term volatility. Overall, while the Nasdaq shows strong recovery and investor interest, caution is warranted given its bearish momentum indicators. The S&P 500 and Russell 2000 display more mixed technical signals, with signs of both cautious optimism and potential selling pressures.
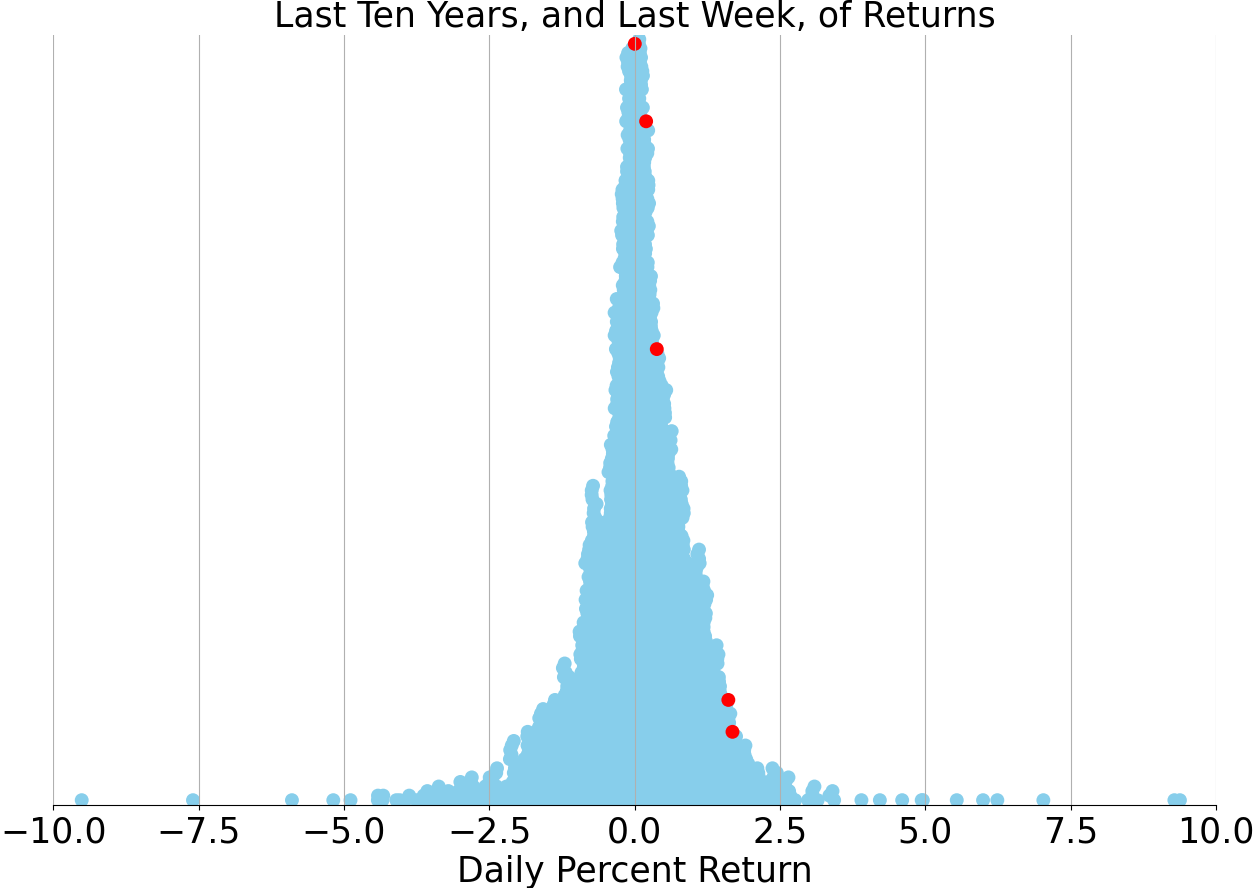
Last week vs. history (Large Cap S&P 500)
Market Commentary
Easing Inflation and Resilient Consumer Spending Boost Market Sentiment
In a welcome turn of events, recent data has shown that inflation is finally cooling after a series of hotter-than-expected readings earlier this year. Both the Producer Price Index (PPI) and the Consumer Price Index (CPI) for July came in below expectations, with headline CPI inflation now at its lowest point for the year. Specifically, headline PPI inflation registered at 2.2% annually, undercutting the forecast of 2.3%, while headline CPI inflation stood at 2.9%, slightly below the anticipated 3.0%. This promising trend is a breath of fresh air for consumers and the Federal Reserve alike, bringing us closer to the Fed's target of 2.0% Personal Consumption Expenditure (PCE) inflation.
Digging deeper into the CPI data, the pricing landscape was mixed but overall encouraging. Notable declines were observed in categories such as food items, apparel, new and used vehicles, and even airline fares. However, inflation remained stubbornly high in areas like shelter and rent, as well as motor vehicle insurance. While the shelter components have been slow to reflect the broader trend, they are expected to catch up in the coming months, offering further support for moderating inflation trends.
The recent data has also provided a glimmer of hope for the U.S. economy, which had been teetering on the edge of a recession. The July nonfarm-jobs report initially sparked fears of an economic downturn, showing a slowdown in job additions and an unexpected rise in the unemployment rate to 4.3%. However, subsequent economic indicators, such as robust retail sales and improving consumer expectations, have painted a more optimistic picture. Retail sales growth for July came in at 1%, significantly above the forecast of 0.4%, and the University of Michigan consumer expectations index also exceeded expectations.
Weekly U.S. initial jobless claims, another critical economic indicator, have shown signs of stabilization. After peaking at 250,000 two weeks ago, the latest reading came in at 227,000, easing concerns of a rapidly deteriorating labor market. This steadiness in jobless claims, coupled with the upcoming nonfarm-jobs report on September 6, will provide valuable insights into the health of the labor market ahead of the Federal Reserve's September 18 meeting.
The softer inflation data and the improving economic outlook have led to speculation about the Federal Reserve's next move on interest rates. While some had speculated on an outsized 0.50% rate cut, the recent data suggests that a traditional 0.25% cut is more likely. The Fed's annual Jackson Hole symposium later this month could provide further clues, as Fed Chair Jerome Powell is expected to outline the central bank's views on inflation and the labor market.
Financial markets have responded positively to the easing inflation and better-than-expected economic data. The S&P 500 has rebounded by over 6.5% since the early August sell-off, and the yield on the 10-year Treasury bond has climbed back to about 3.9%, signaling renewed confidence in the broader economy. The VIX volatility index, often referred to as Wall Street's fear gauge, has also come down significantly from its recent highs.
The technology and growth sectors have led the recent market recovery, a continuation of a trend seen over the past couple of years. As we approach a period of potential Fed rate cuts and continued moderation in inflation, there is a growing belief that market leadership could broaden. Sectors like industrials and utilities, which have lagged behind, may start to catch up, offering a more diversified market landscape.
History suggests that if the Fed begins cutting interest rates and the economy avoids a hard landing, financial markets can perform well in such an environment. While seasonal volatility and upcoming U.S. elections could introduce market fluctuations, these periods may present opportunities for savvy investors. With better inflation trends and a cooling yet resilient economy, the outlook remains cautiously optimistic.
In summary, the recent easing of inflation and resilient consumer spending have provided a much-needed boost to market sentiment. As we await further data and the Federal Reserve's next moves, the financial landscape appears to be stabilizing, offering a more balanced outlook for the months ahead. Investors would do well to stay informed and consider diversification as a strategy to navigate the evolving market conditions.
Stock study for Tuesday
Dollar Tree, Inc. operates 16,774 retail discount stores under the brands Dollar Tree, Family Dollar, and Dollar Tree Canada across the U.S. and Canada. The company is divided into two business segments: Dollar Tree, which primarily offers merchandise at the $1.25 price point with some multi-price options, and Family Dollar, which targets lower-income customers with goods priced between $1.00 and $10.00. Growth strategies involve new store openings, expanding product assortments, renovating stores, investing in the workforce, and modernizing supply chains and technology. Key initiatives include expanding Dollar Tree's multi-price product range and partnering with Instacart for same-day delivery from over 15,000 stores. Family Dollar is also enhancing store formats and product assortments tailored to local demographics and expanding private label offerings.


Comments ()