
The Monday Charge: April 8, 2024
The robust employment data has two faces: on one hand, it's a testament to the underlying strength of the economy, with consumer spending and GDP growth buoyed by a tight labor market. On the other hand, it raises concerns among those who are eager for a Fed rate cut...

This is our Monday article, focusing on the large cap S&P 500 index. Just the information you need to start your investing week. As always, 100% generated by AI and Data Science, informed, objective, unbiased, and data-driven.
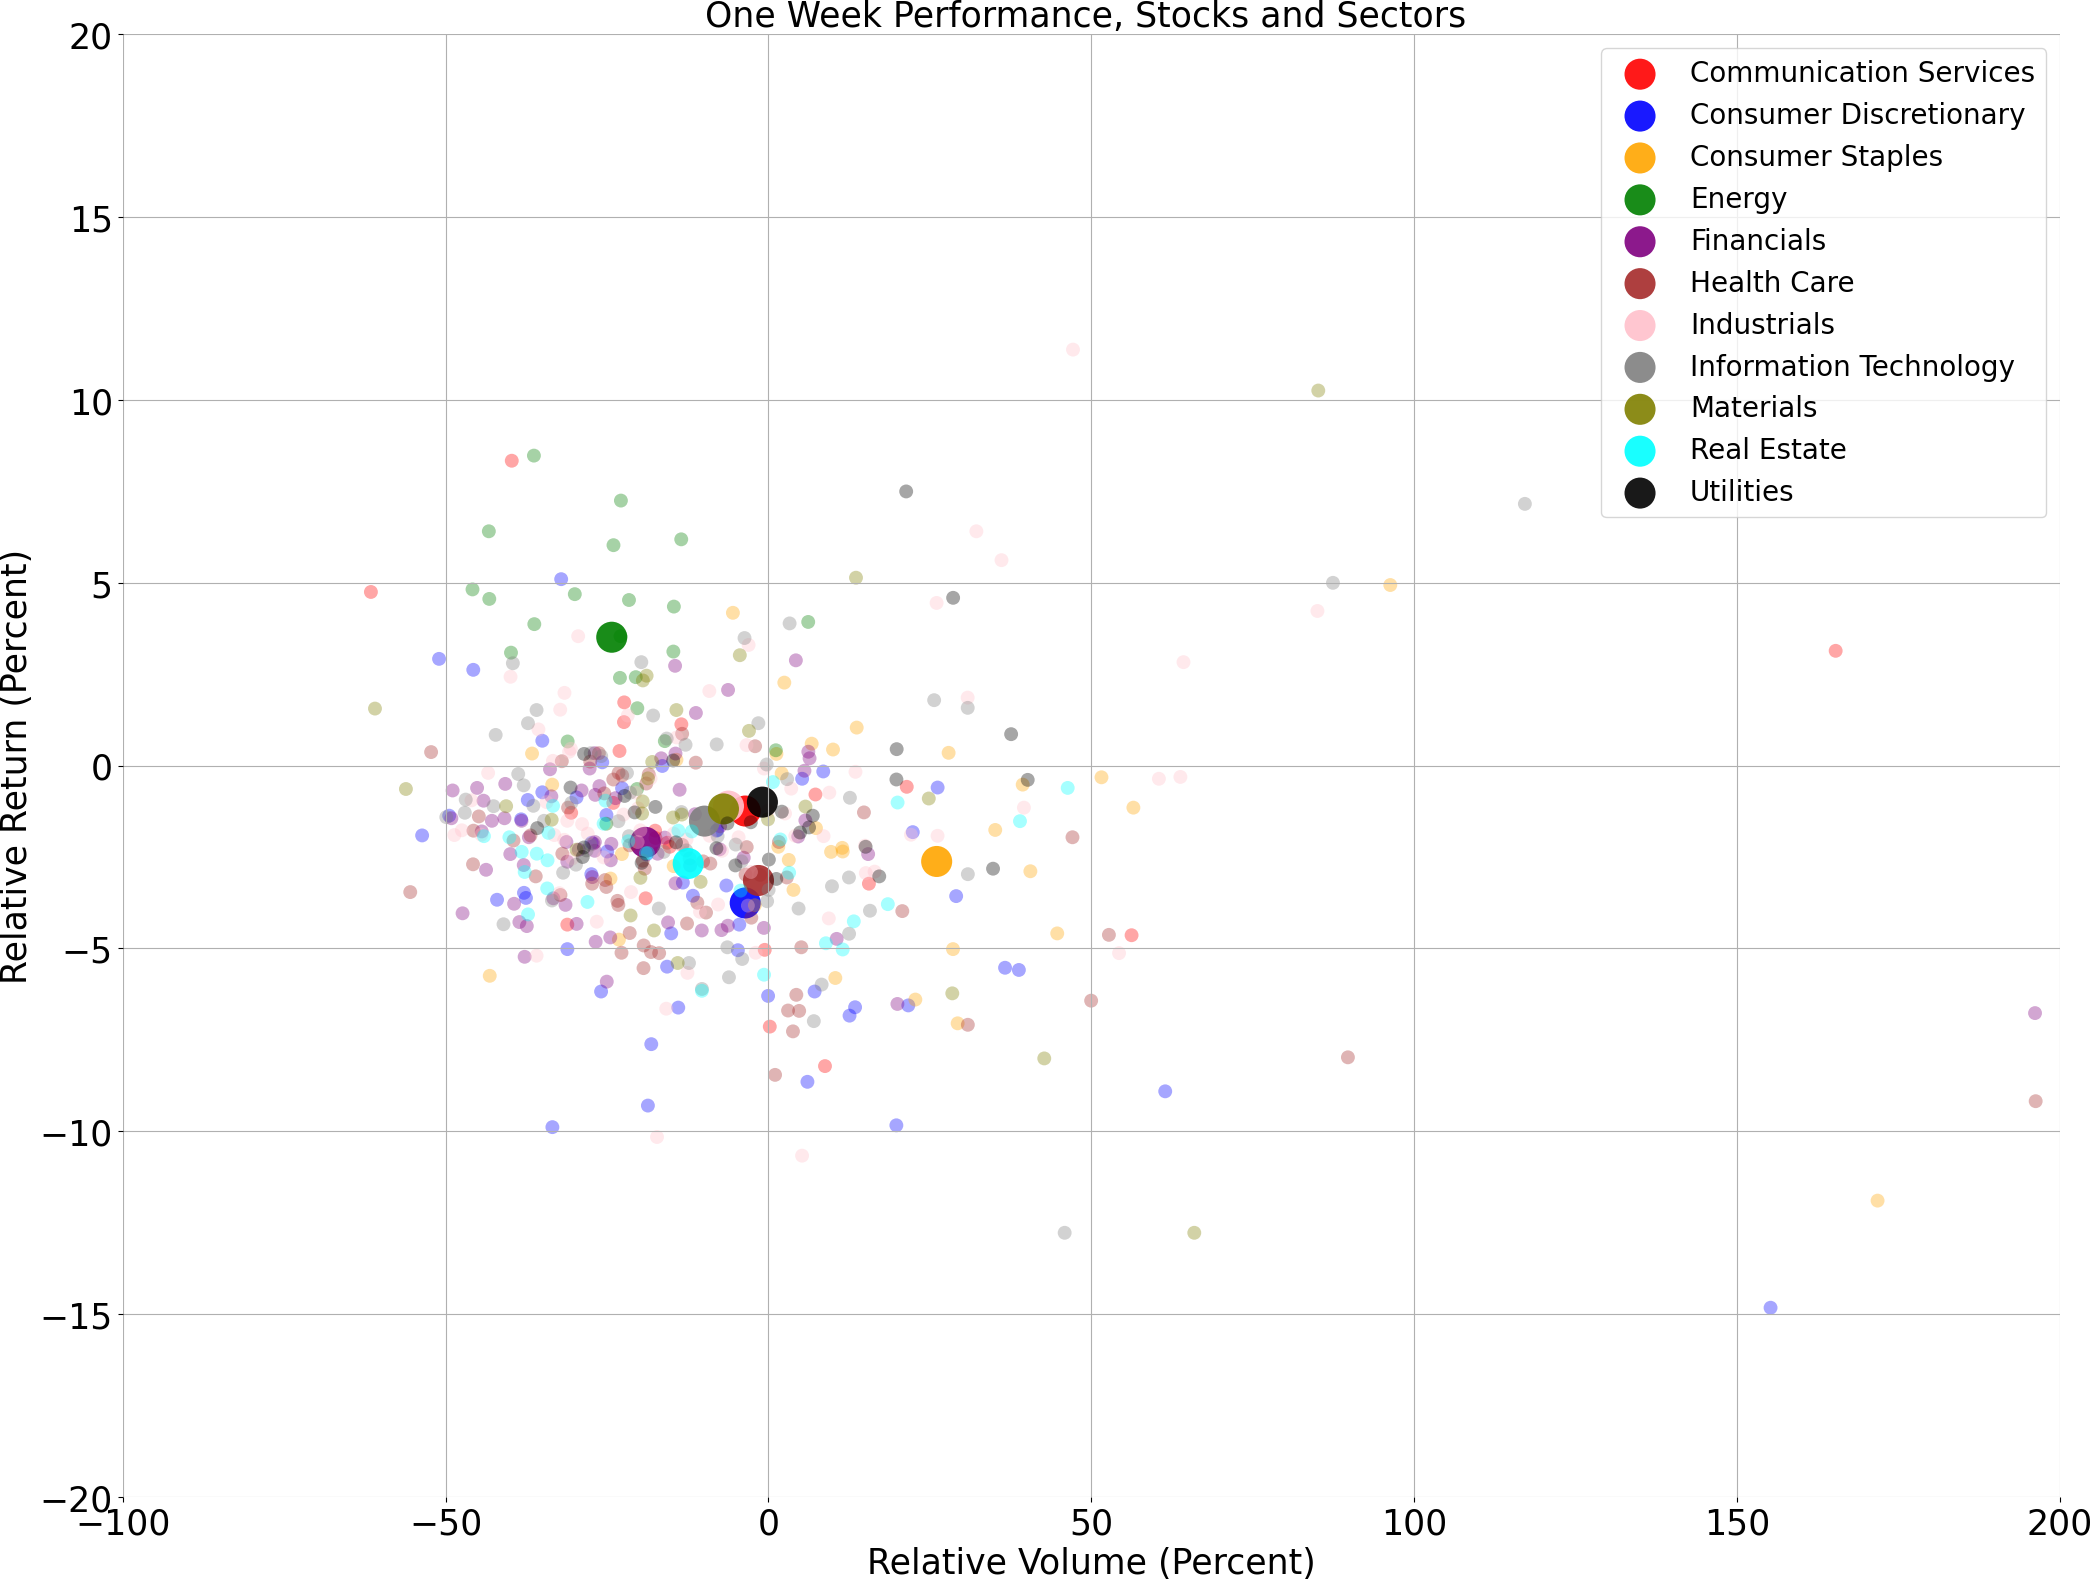
The biggest movers last week on price and volume (Large Cap S&P 500)

Price and volume moves last week for every stock and sector (Large Cap S&P 500)
A technical analysis across indices
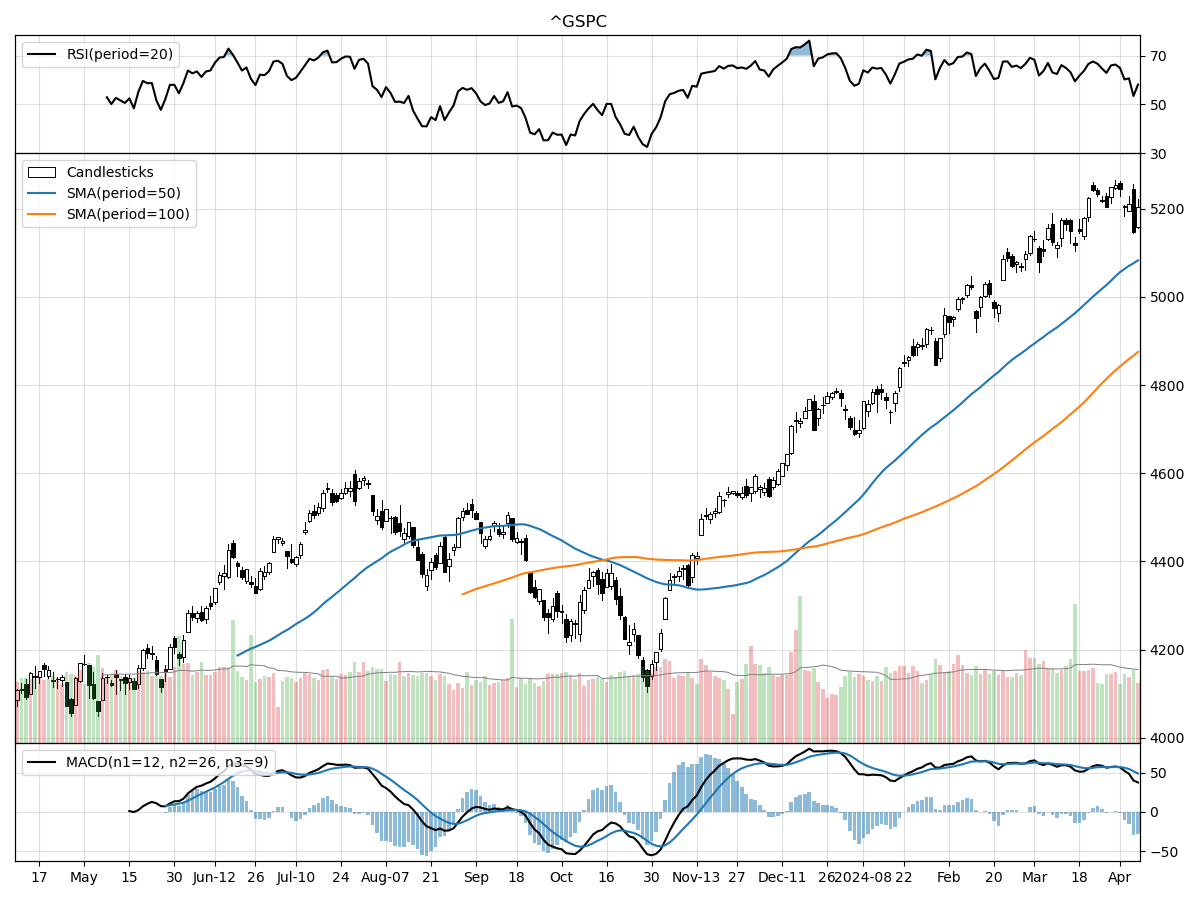
S&P500
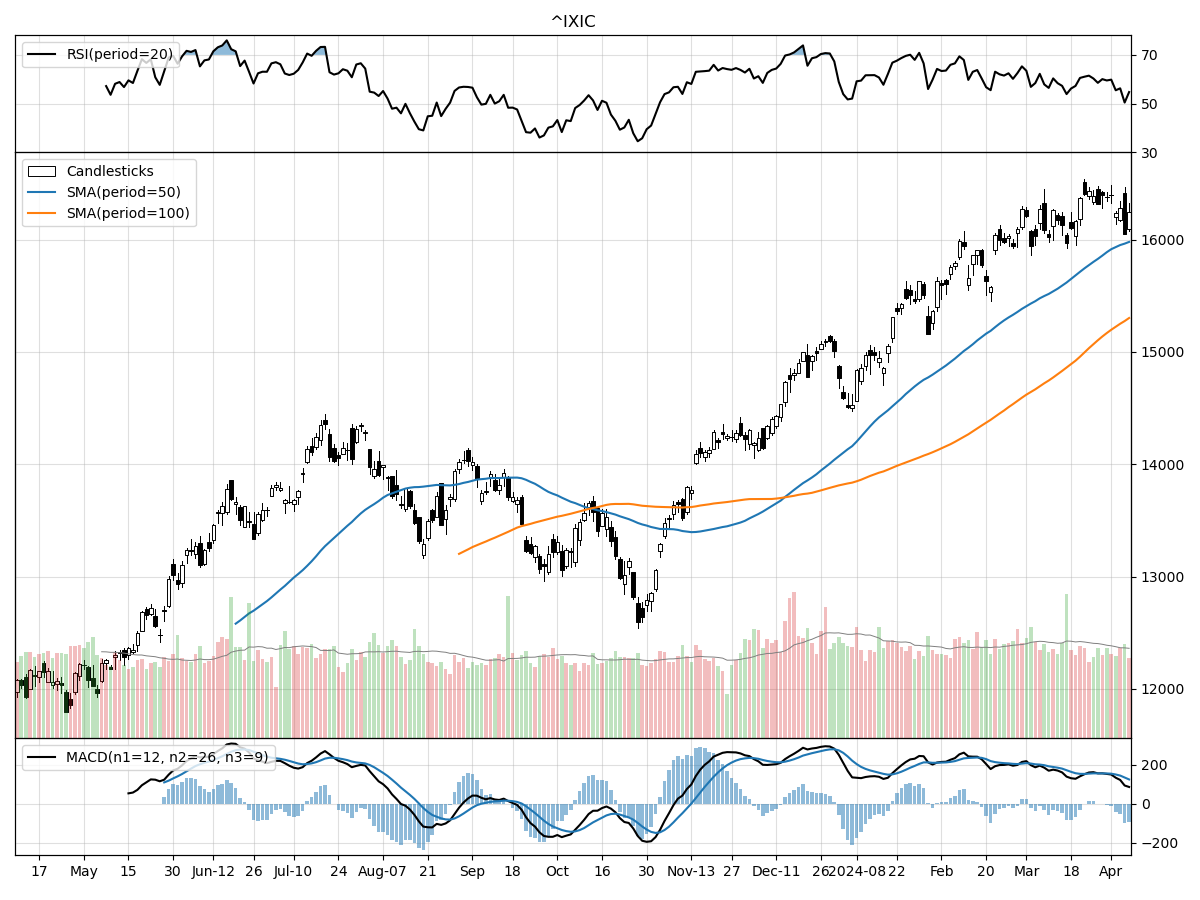
Nasdaq
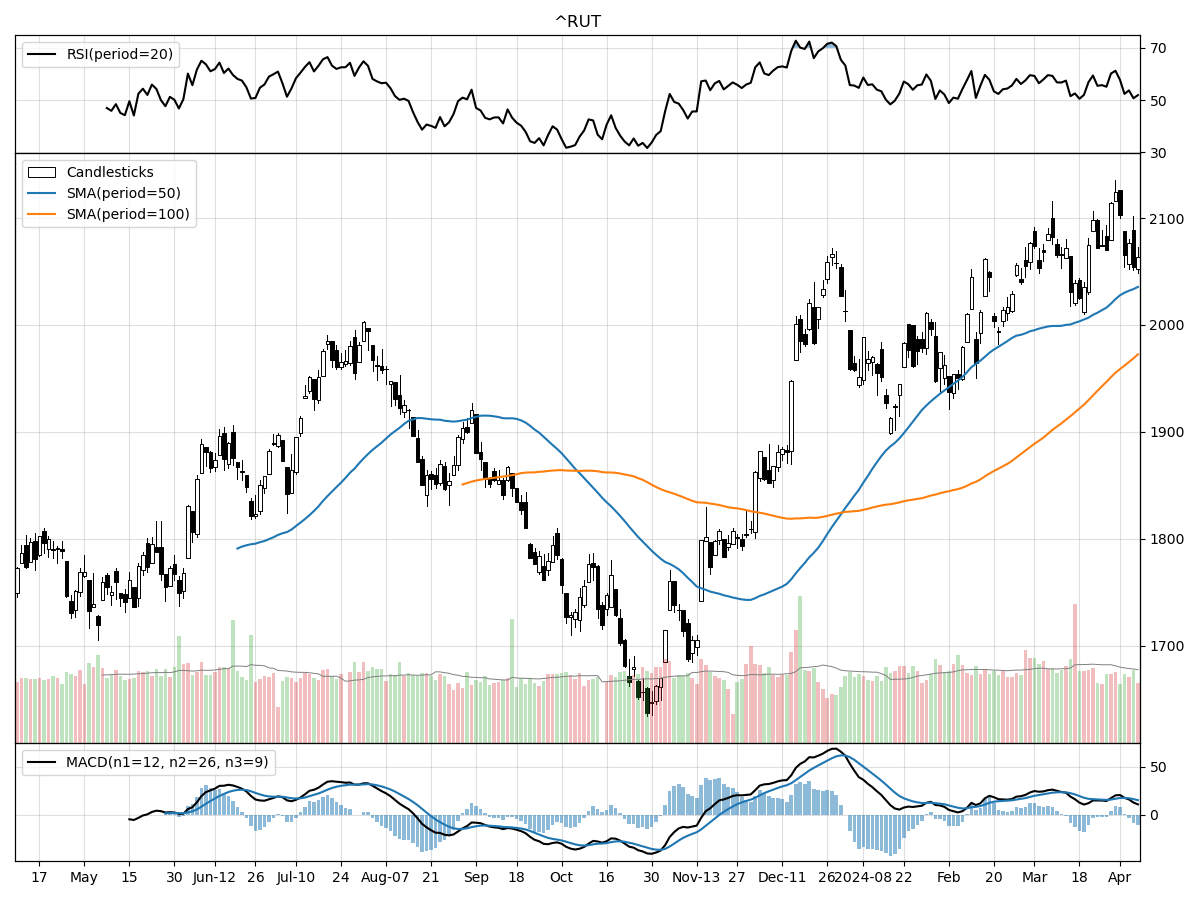
Russell 2000
When comparing the technical performance across the S&P 500, Nasdaq, and Russell 2000 Small Cap indices, several key observations can be made. Starting with the S&P 500, it's noteworthy that the index is trading at its 52-week high, indicating a strong bullish sentiment in the market. The price stability over the last month combined with an 8.8% rise over the past three months suggests a steady uptrend. The Money Flow indicators point to moderate buying pressure, and the bullish MACD (Moving Average Convergence Divergence) of 48.92 reinforces this positive outlook. The daily volume is slightly above the long-term average, which could be seen as a confirmation of sustained interest in the market.
The Nasdaq, on the other hand, is trading just 1% below its 52-week high, which is also a sign of bullishness. However, the index has seen a similar performance to the S&P 500 in terms of price stability over the last month and an almost parallel increase over the last three months, with an 8.54% rise. Similar to the S&P 500, the Nasdaq is under moderate buying pressure according to Money Flow indicators, and the bullish MACD at 123.5 is quite strong, potentially indicating even more bullish momentum than the S&P 500. The Nasdaq's daily volume is above the long-term average, suggesting a healthy trading activity.
Comparatively, the Russell 2000 Small Cap index presents a slightly different picture. Although it has also maintained price stability over the last month, it has not shown a significant increase over the past three months, indicating a period of consolidation or range-bound trading. The current price is 26% above its 52-week low and 2% below its 52-week high, reflecting a narrower range of recent price action compared to the S&P 500 and Nasdaq. The Money Flow indicators hint at moderate selling pressure, in contrast to the other indices, and the bullish MACD of 15.06 is the lowest among the three, which might suggest a weaker bullish sentiment. The daily volume is in line with the long-term average, showing no significant deviation in trading interest.
In summary, while all three indices are displaying bullish technical indicators, the S&P 500 and Nasdaq are showing stronger bullish momentum compared to the Russell 2000. The S&P 500 is at its peak while the Nasdaq is just a notch below its high, both with increasing volumes and bullish MACD indicators. The Russell 2000's recent performance indicates a more cautious approach by investors, with signs of distribution and moderate selling pressure. Investors might interpret this as a sign of a more risk-averse attitude towards small-cap stocks relative to their large-cap counterparts.
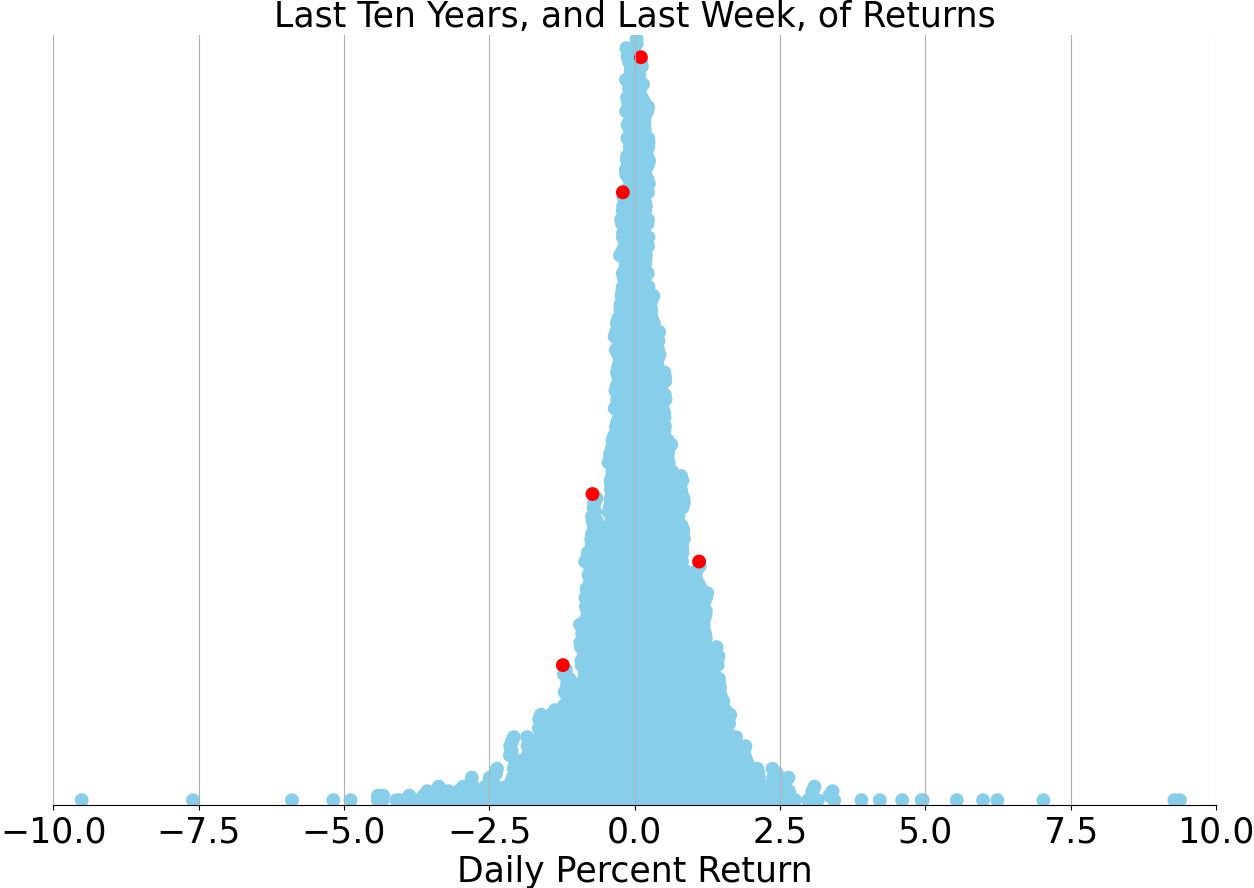
Last week vs. history (Large Cap S&P 500)
Market Commentary
As investors navigate the complex interplay between employment data and inflation, the Federal Reserve's interest rate decisions remain at the forefront of market dynamics. The latest labor market report delivered a robust picture, with nonfarm payrolls surging by 303,000 in March, significantly surpassing expectations. This vigorous hiring spree signals a labor market that is resilient, though some analysts suggest that we may be witnessing the peak of its vigor.
The robust employment data has two faces: on one hand, it's a testament to the underlying strength of the economy, with consumer spending and GDP growth buoyed by a tight labor market. On the other hand, it raises concerns among those who are eager for a Fed rate cut, as persistent labor market strength could delay the Fed's pivot from its current hawkish stance. Despite this, the market's reaction to the strong jobs report was largely positive, hinting at optimism for a "soft landing" scenario where the economy slows enough to curb inflation without triggering a recession.
Analyzing historical trends, the S&P 500 has often found solid ground when unemployment rates hover below 4.5%. With the unemployment rate currently at 3.8%, up from its recent low of 3.4%, the trajectory suggests a moderate rise rather than a sharp increase. This gradual uptick in unemployment could be the cushion needed for the economy to ease into a more sustainable pace without overheating.
Wage growth, a critical factor in inflation trends, is showing signs of moderation. A slower increase in wages might not be immediately welcome news for workers, but it's an essential component in the broader fight against inflation. The dip in the job quits rate points to a cooling off in wage pressures, which, if sustained, could help ease inflationary concerns and potentially pave the way for a Fed rate cut later in the year.
In the manufacturing sector, a return to expansion in March, after 18 months of contraction, adds another layer to the economic narrative. The ISM Manufacturing PMI's ascent to its highest level since 2022 suggests that industry is finding its footing again, which could bode well for economic diversity and stability.
Investors are now bracing for the upcoming CPI inflation data and the release of the FOMC minutes from the March meeting. These will be critical in shaping expectations for future interest rate movements. The market's ability to maintain its composure amidst these releases will be telling of investor sentiment and the perceived trajectory of the U.S. economy.
In conclusion, the current financial landscape is a balancing act between sustaining growth and managing inflation, with the Fed's policy decisions acting as the fulcrum. As the market digests the latest economic data, the path forward hinges on a confluence of factors, from wage trends to manufacturing health, all of which will inform the Fed's strategy in the coming months. Investors remain watchful, knowing that in this delicate equilibrium, every data point has the power to tip the scales.
AI stock picks for the week (Large Cap S&P 500)


