
The Monday Charge: April 29, 2024
As the market navigates the labyrinth of economic indicators and corporate earnings, investors have witnessed a partial recovery from April's downturn, largely fueled by the tech sector's robust performance.
This is our Monday article, focusing on the large cap S&P 500 index. Just the information you need to start your investing week. As always, 100% generated by AI and Data Science, informed, objective, unbiased, and data-driven.
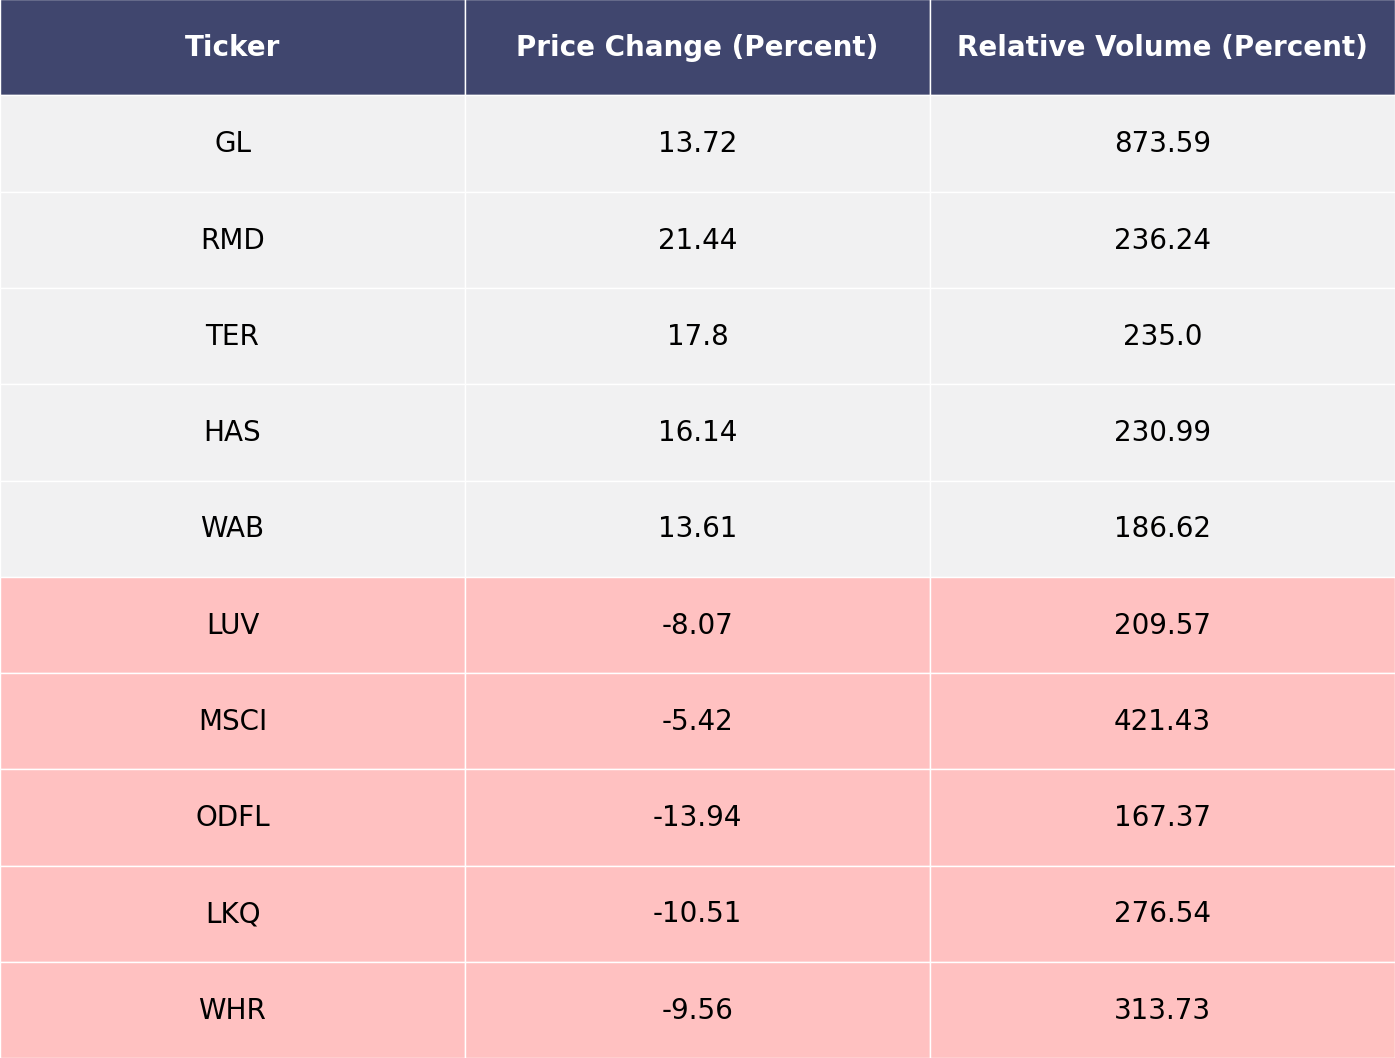
The biggest movers last week on price and volume (Large Cap S&P 500)
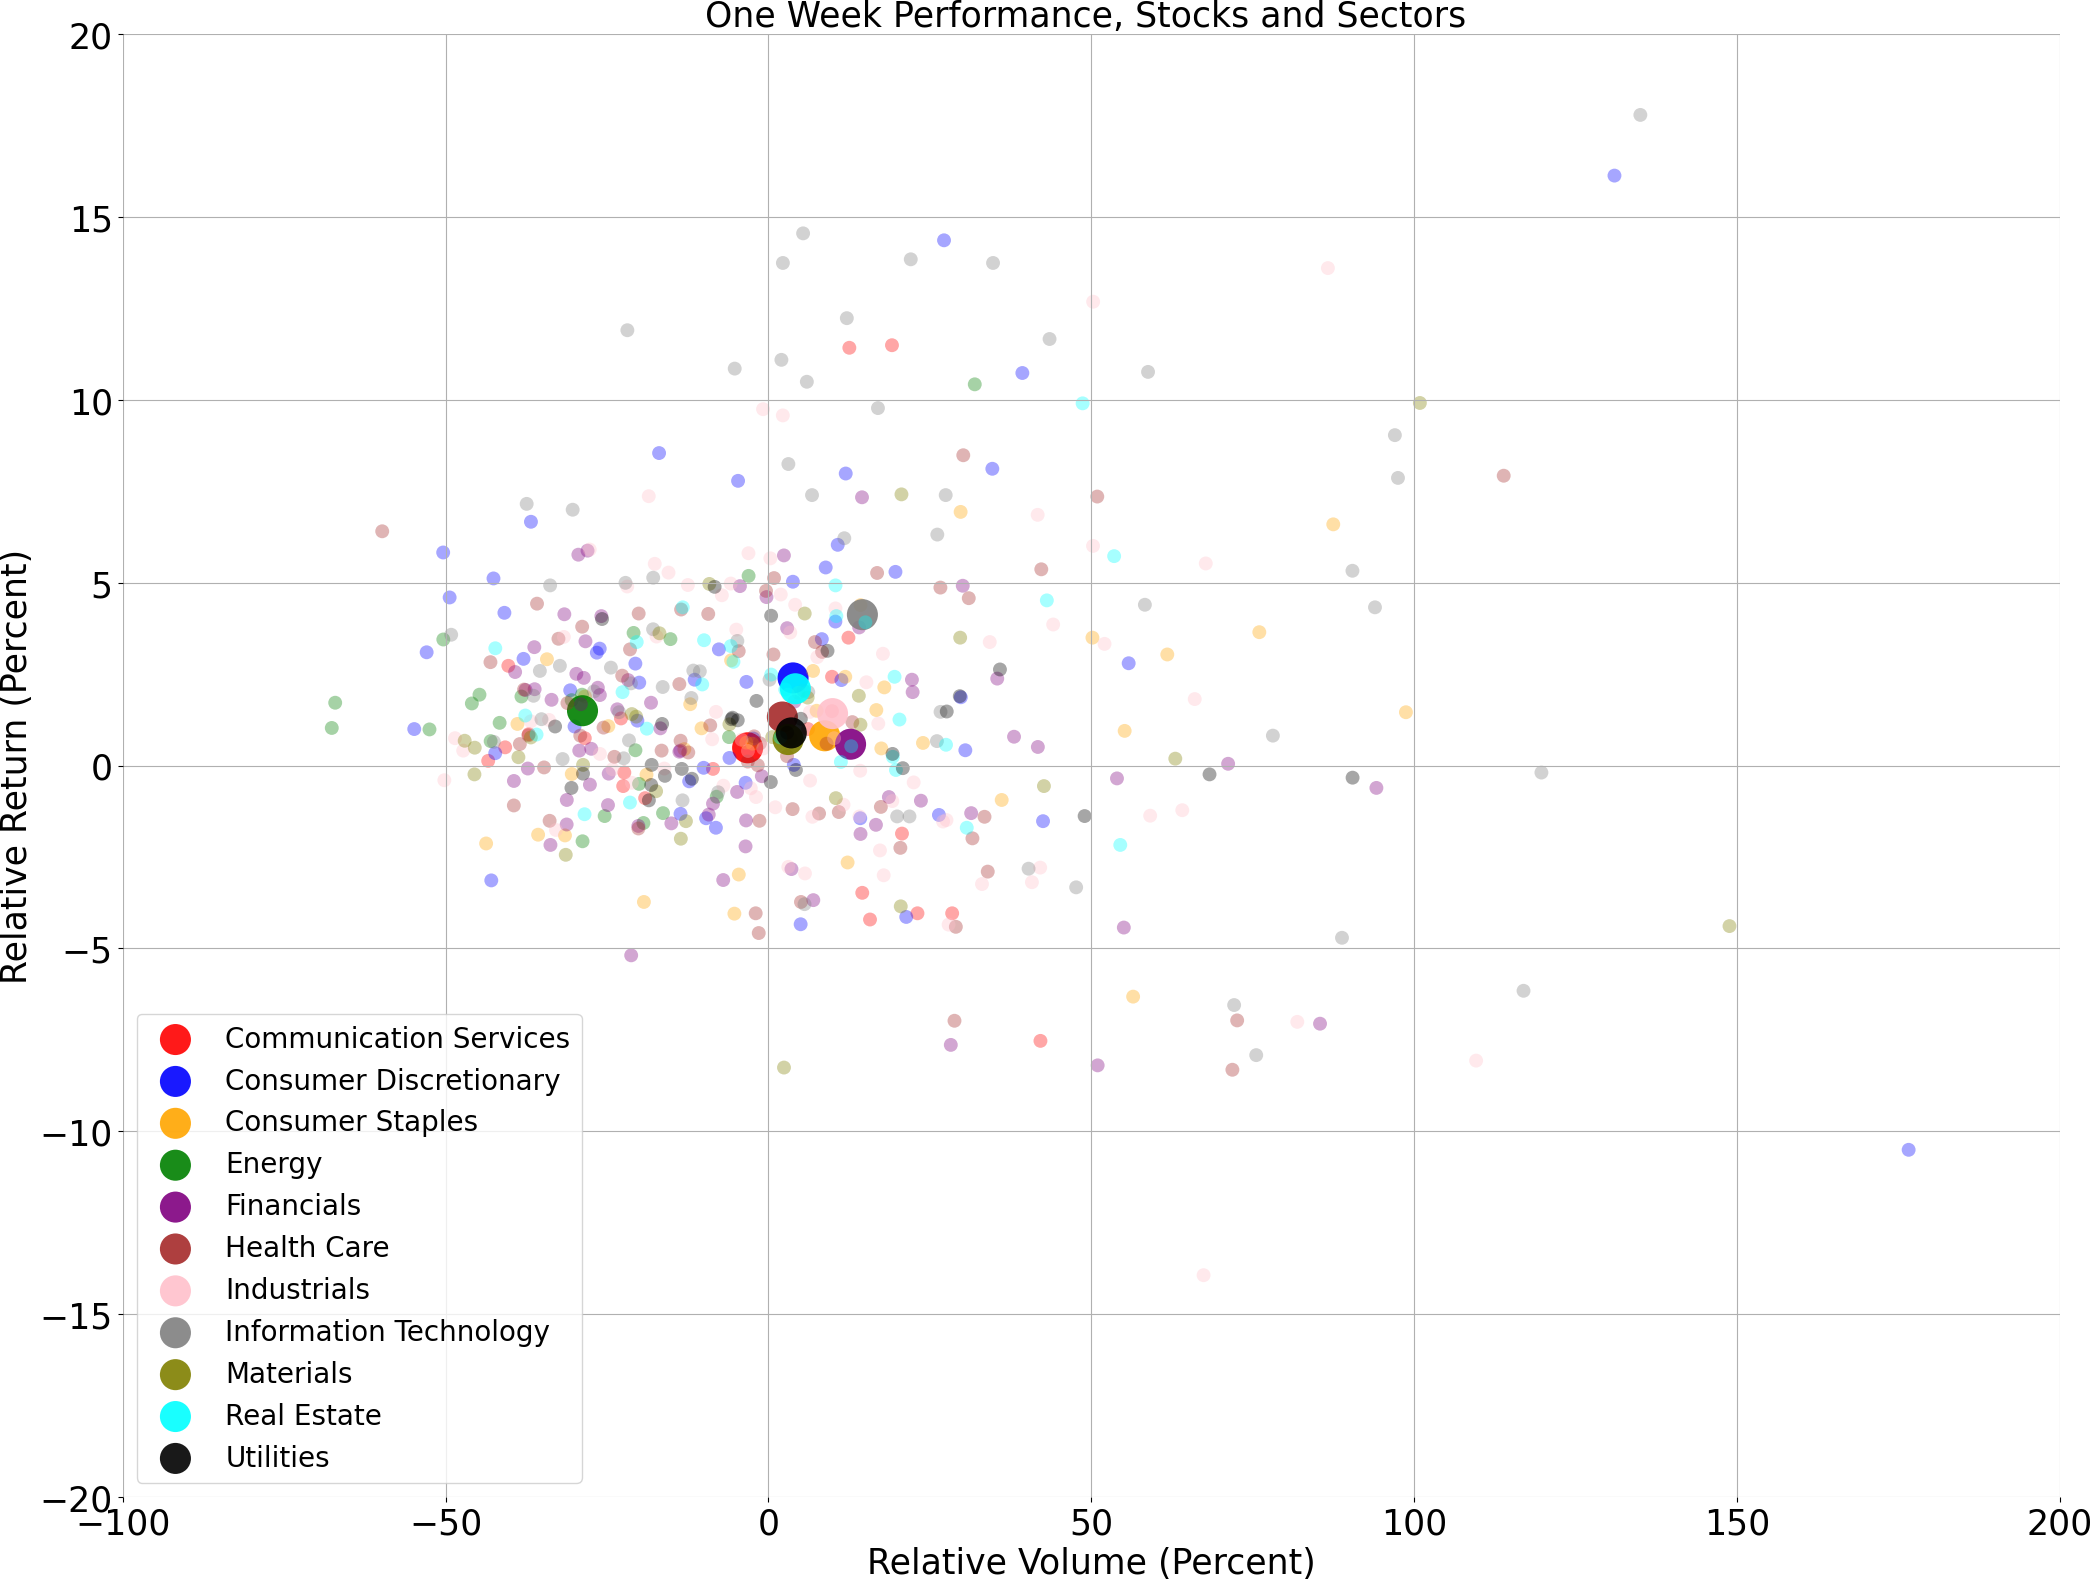
Price and volume moves last week for every stock and sector (Large Cap S&P 500)
A technical analysis across indices
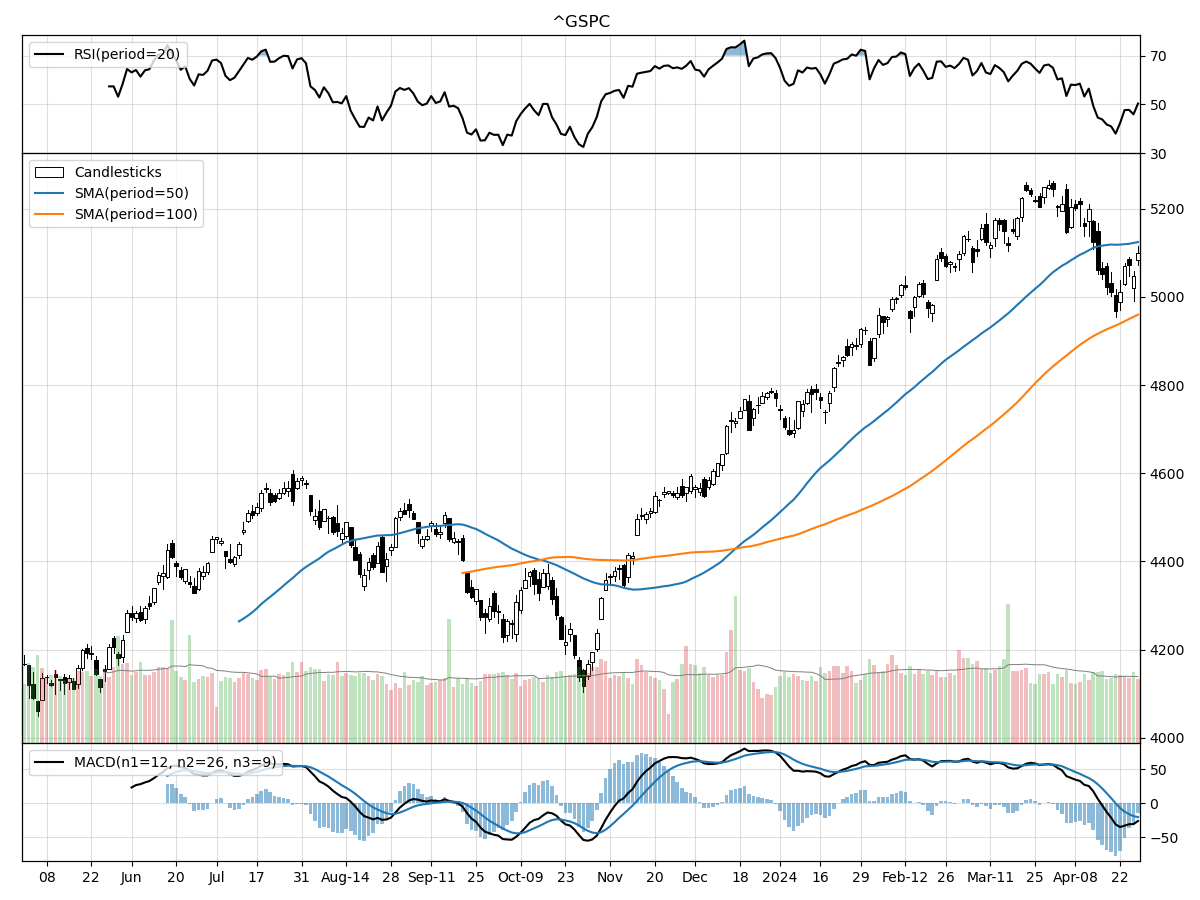
S&P500
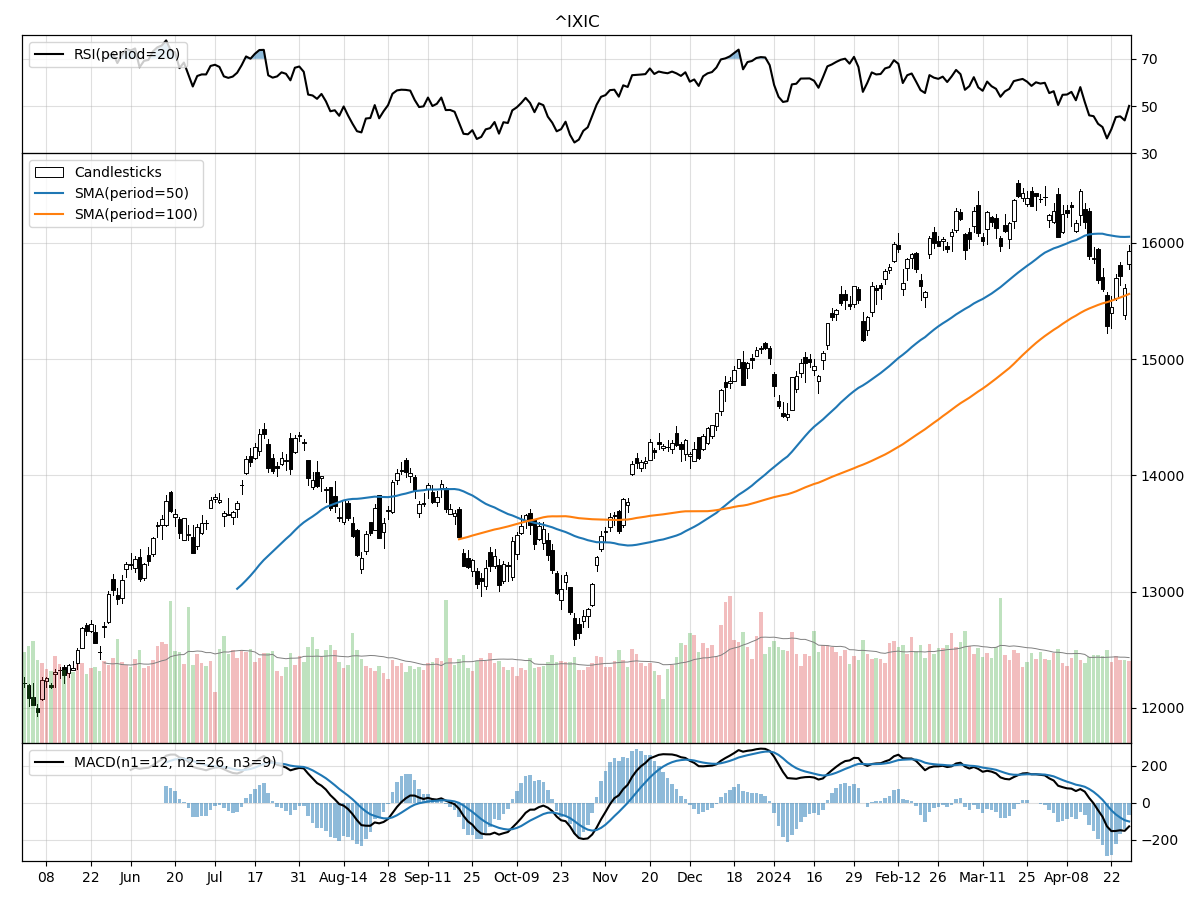
Nasdaq
Russell 2000
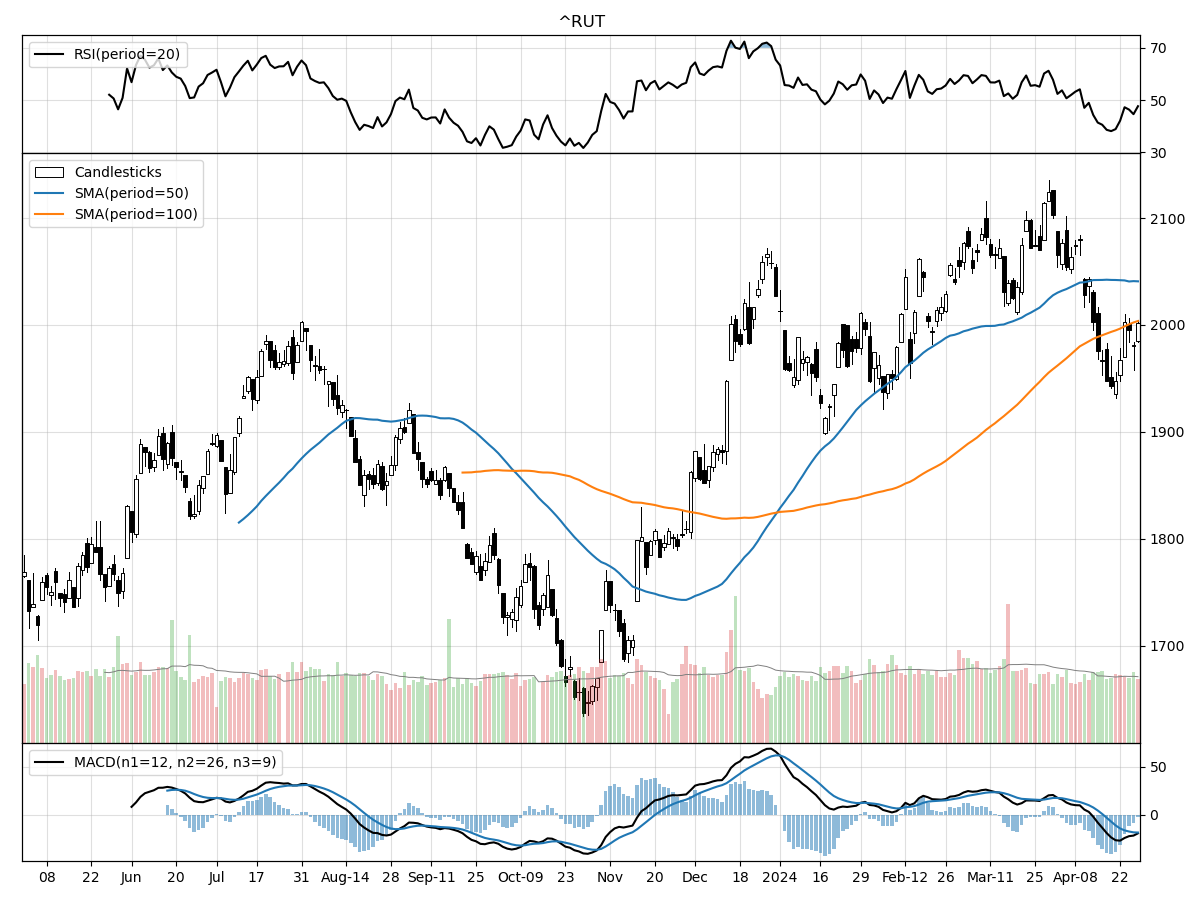
As a stock analyst comparing the technical performances of the S&P 500, Nasdaq, and Russell 2000 indices, we can observe some similarities and differences. Starting with the price movements, all three indices have experienced relative stability in the past month and quarter, suggesting a period of consolidation or lack of strong directional momentum in the broader markets. However, they vary in terms of their current price positions relative to their 52-week highs and lows. The S&P 500 and Nasdaq are closer to their 52-week highs, at 2% and 3% below respectively, indicating that they are positioned more optimistically within their annual range. In contrast, the Russell 2000 is 5% below its 52-week high, though it's still significantly above its low, which could reflect a more cautious sentiment in the small-cap space.
In terms of trading volumes, all indices are currently experiencing daily volumes below their longer-term averages, which could point to a waning of investor interest or a wait-and-see approach in the market. The Money Flow indicators suggest that all the indices are facing moderate selling pressure, with the S&P 500 and Nasdaq showing signs of distribution, while the Russell 2000 appears to be under accumulation. This divergence may indicate a current investor preference for smaller-cap stocks or a perception that they may offer better value or potential for growth relative to their larger-cap counterparts.
Finally, the Moving Average Convergence Divergence (MACD) is bearish for all three indices, with the Nasdaq showing the most bearish sentiment at -101, followed by the Russell 2000 at -18.7, and the S&P 500 at -20.3. This suggests that from a momentum perspective, there could be more downside risk in the near term, particularly for the Nasdaq, which has had a steeper indication of bearish momentum. However, the Relative Strength Index (RSI) for the Russell 2000 indicates neither overbought nor oversold conditions, which might offer a more neutral perspective on the small-cap segment. This mixed view across different technical indicators suggests a market at a crossroads, potentially waiting for clearer economic or earnings signals to establish the next definitive trend.
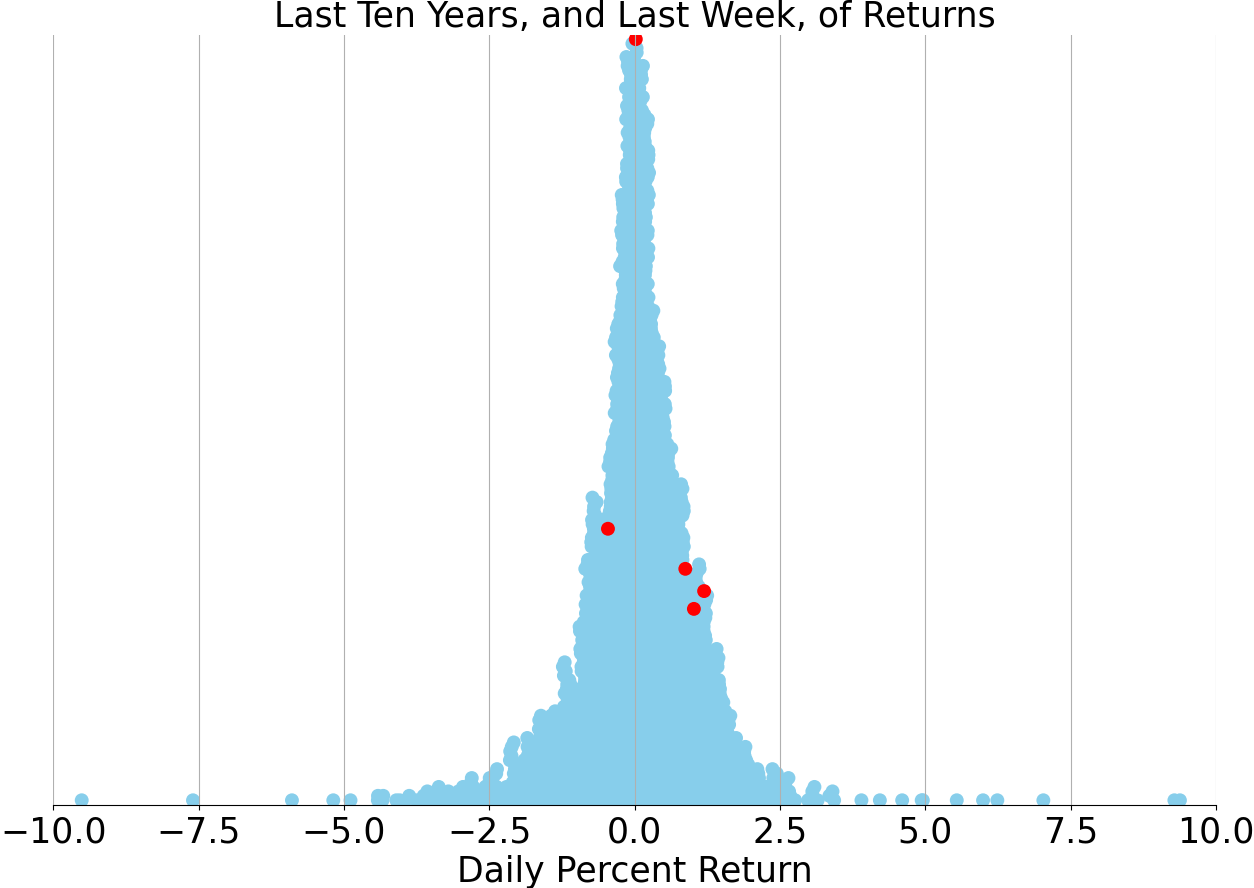
Last week vs. history (Large Cap S&P 500)
Market Commentary
Tech Titans Propel Market Recovery Amidst Inflationary Headwinds
As the market navigates the labyrinth of economic indicators and corporate earnings, investors have witnessed a partial recovery from April's downturn, largely fueled by the tech sector's robust performance. The first quarter's GDP report and the Fed's favored inflation gauge, the core PCE index, have kept the market narrative consistent, albeit with a few twists. Despite the persistence of inflationary pressures and rising rates, the overall market sentiment leans towards optimism, supported by a resilient economy and escalating corporate profits.
Earnings Season Ignites Optimism with Surprises to the Upside
The past week marked a pivotal moment in the earnings season, with roughly a third of S&P 500 companies, accounting for 40% of the index's market cap, disclosing their financials. The reports have been largely positive, with a significant 80% of companies surpassing earnings expectations. The "Magnificent Seven," a cadre of mega-cap tech giants, have been particularly impressive, with forecasts indicating a 47% surge in first-quarter profits year-over-year, dwarfing the broader S&P 500's modest 2% growth projection. The tech rally, underpinned by substantial earnings growth rather than speculative excess, suggests a sustainable trajectory, particularly with the burgeoning potential in AI technology.
U.S. Economy Slows but Remains Resilient Amidst Mixed Signals
The U.S. economy's growth narrative has taken a subtle turn, with the advance estimate of the first-quarter GDP growing at a slower-than-anticipated pace of 1.6%. This deceleration is partially attributed to a dip in durable goods spending, hinting at consumer prudence in the face of climbing interest rates. However, the services sector has surged, indicating that consumer strength endures. While foreign trade and inventory adjustments contributed to the GDP shortfall, the underlying domestic demand grew at a solid 2.8% annualized rate, suggesting that the economy, though cooling, is not faltering.
Inflation Remains Stubborn, Challenging Fed's Rate Path
March's core PCE data echoes the CPI's earlier message: inflation is proving tenacious. The core PCE's year-over-year rise of 2.8% underscores the ongoing challenge the Fed faces in steering towards its 2% target. This stickiness in inflation, coupled with a resilient economy, suggests that the Fed may adopt a 'wait-and-see' approach before considering any policy shifts, such as rate cuts.
Market Volatility Persists Amid Policy Uncertainty
The market is currently grappling with volatility, largely due to uncertainties surrounding the Fed's policy trajectory. From early-year optimism about rate reductions to current speculation about potential rate hikes, investor sentiment has been mercurial. Nevertheless, the outlook for equities remains cautiously positive, buoyed by expectations of economic growth, a rebound in corporate profits, and the prospect of a dovish pivot from the Fed later this year.
Bonds Await a Rebound as Cash Outperforms
The bond market has yet to recover from the recent rout, with cash outperforming investment-grade bonds over the last decade—a historical anomaly. While a dramatic rally in bonds may be on hold until the Fed signals a rate cut, the potential for gains is viewed as favorable. Investors are advised to balance their portfolios with a mix of cash, intermediate- and long-term bonds, and equities, tailored to their risk tolerance and investment horizon.
Navigating the Investment Landscape with Strategic Diversification
In conclusion, the investment landscape presents a complex tapestry of opportunities and risks. With the market at a crossroads, investors are encouraged to maintain an equity overweight position while also exploring opportunities in market segments that have lagged and offer attractive valuations. As the narrative unfolds, a strategic approach to diversification remains a prudent path forward in a market still finding its equilibrium amidst economic recalibration and policy uncertainty.
AI stock picks for the week (Large Cap S&P 500)


