
The Monday Charge: April 22, 2024
As the financial landscape navigates through a period of readjustment, investors are witnessing a softening of markets following a robust six-month rally...

This is our Monday article, focusing on the large cap S&P 500 index. Just the information you need to start your investing week. As always, 100% generated by AI and Data Science, informed, objective, unbiased, and data-driven.
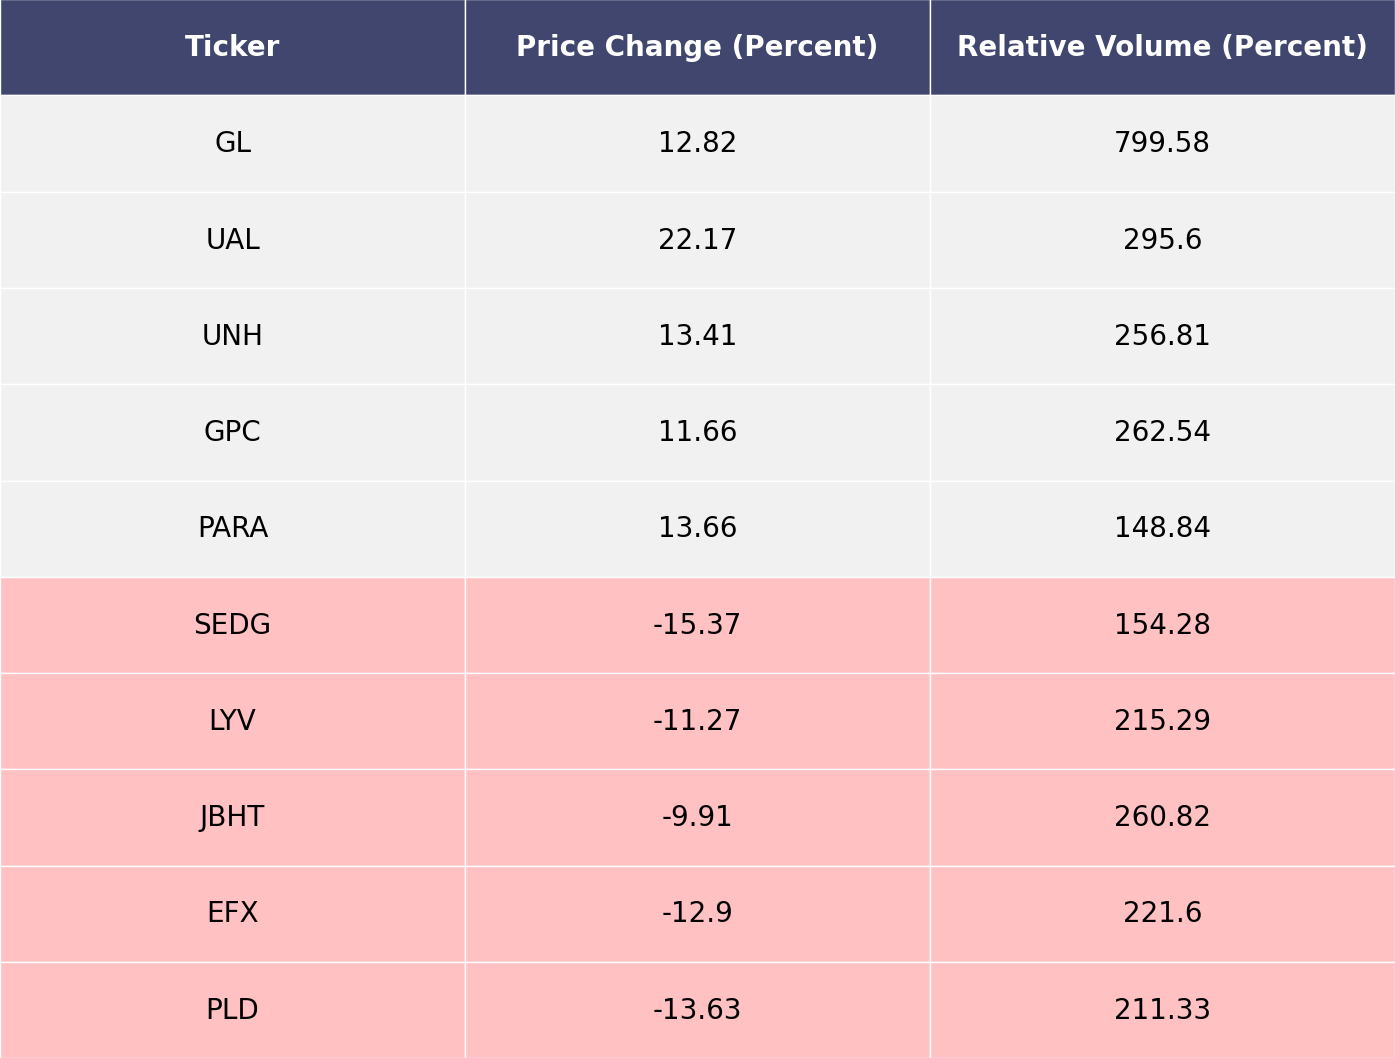
The biggest movers last week on price and volume (Large Cap S&P 500)
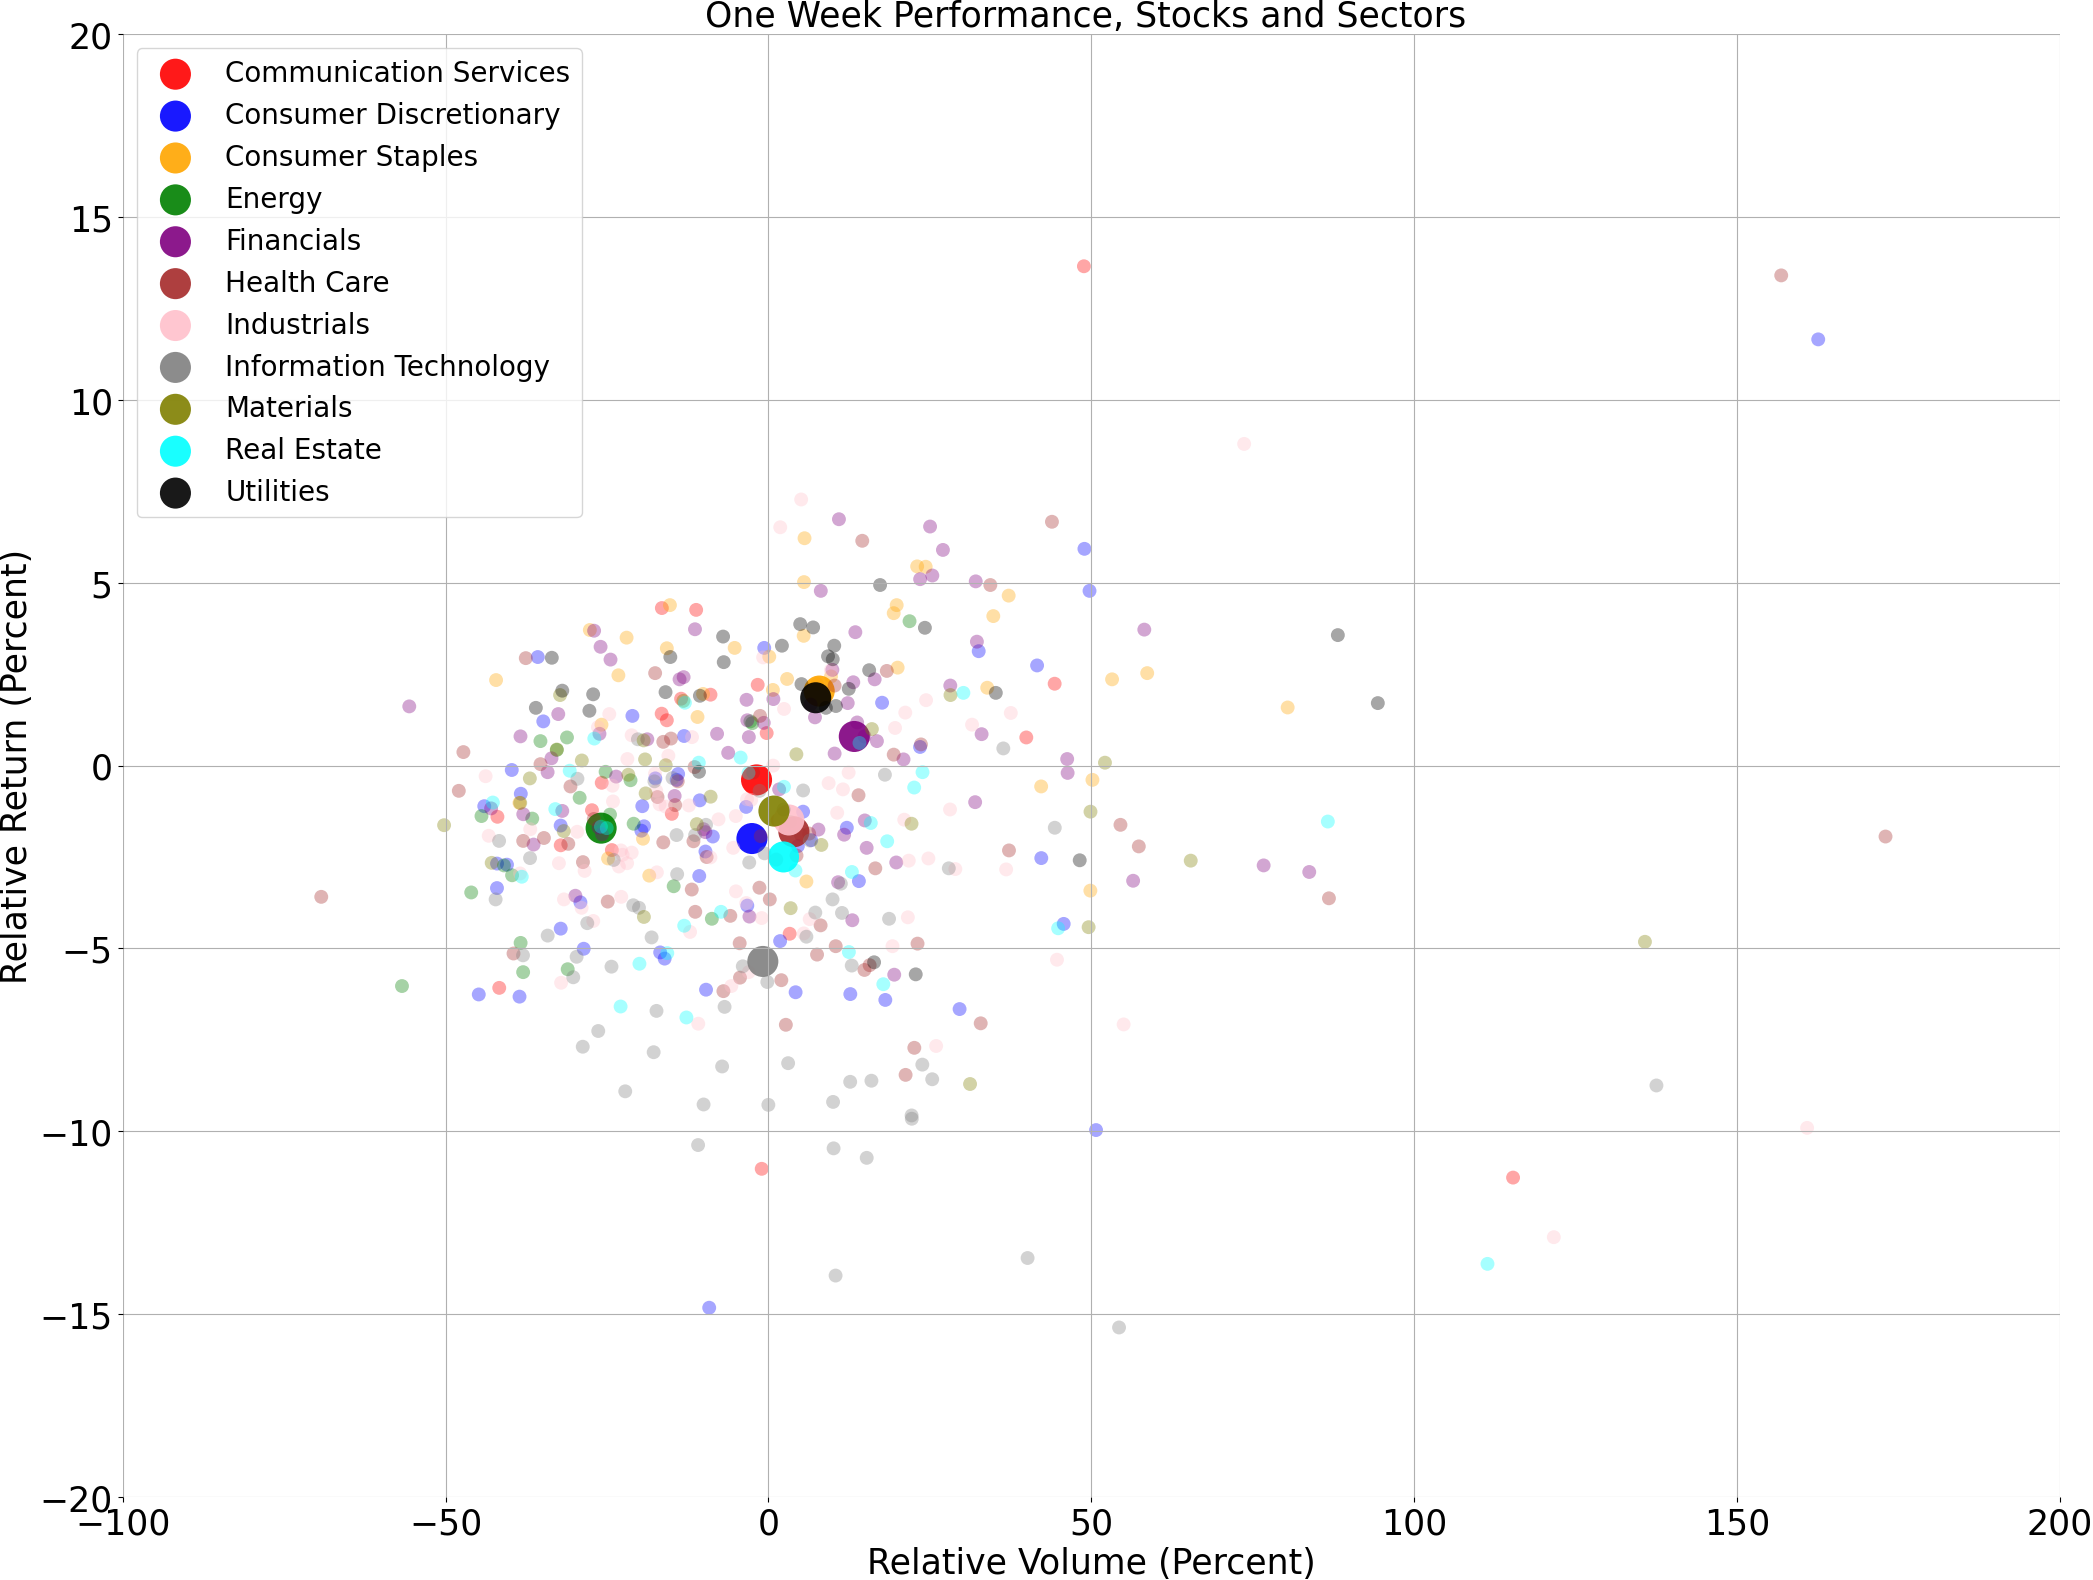
Price and volume moves last week for every stock and sector (Large Cap S&P 500)
A technical analysis across indices
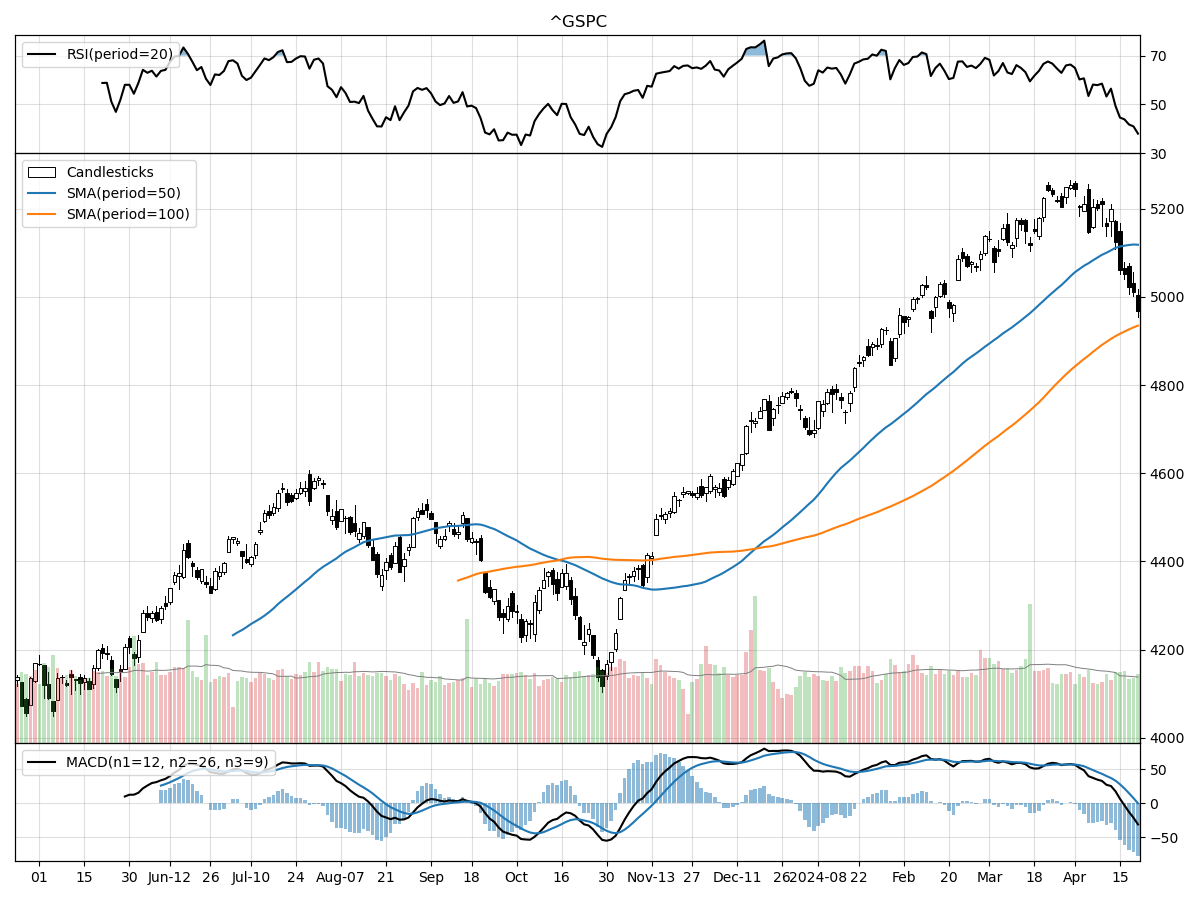
S&P500
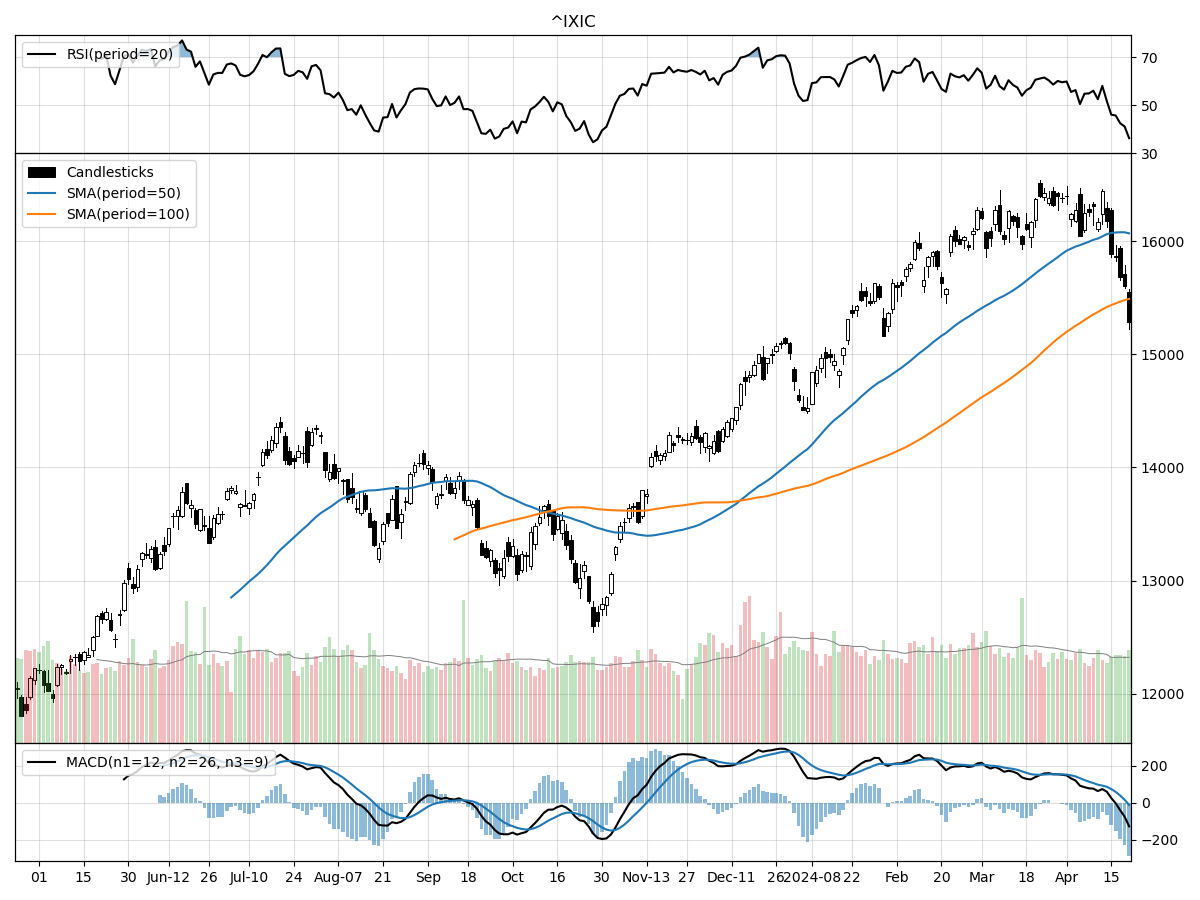
Nasdaq
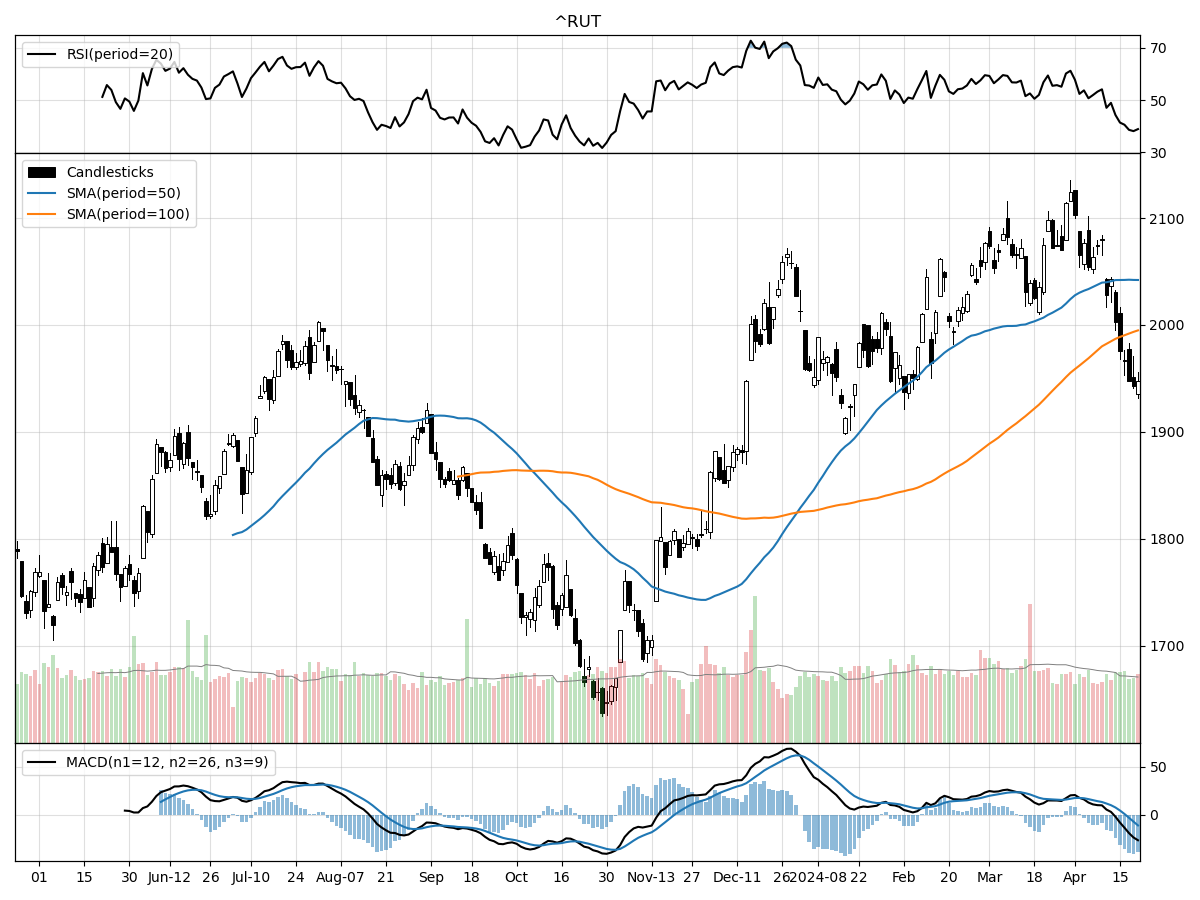
Russell 2000
Reviewing the technical performances of the S&P 500, Nasdaq, and Russell 2000 Small Cap indices provides a comprehensive picture of the broader market sentiment and risk appetite among investors. The S&P 500, being a broad representation of large-cap stocks, shows a recent decline with a 5.10% drop over the last month, indicating a potential cooling-off period or consolidation phase after a bullish stretch. It is currently trading 5% below its 52-week high and 22% above its 52-week low, suggesting that while it has retreated from peak levels, it still maintains a significant buffer above its annual lows. The negative Moving Average Convergence Divergence (MACD) value of -0.11 and the indication of moderate selling pressure and stock distribution suggest caution among investors, possibly due to macroeconomic concerns or a shift in market sentiment.
In contrast, the Nasdaq, which is heavily weighted towards technology and growth stocks, has experienced a slightly larger decline of 6.98% over the last month. This decline can sometimes be attributed to the higher volatility inherent in technology stocks, which are often more sensitive to interest rate changes and economic forecasts. The Nasdaq is also trading closer to its 52-week low, at 29% above, and 7% below its 52-week high, indicating a more pronounced pullback. The more substantial negative MACD value of -12.3 reinforces the bearish momentum seen in the index.
Lastly, the Russell 2000 Small Cap index, which represents small cap stocks and is often viewed as a barometer for domestic economic health and investor risk tolerance, has also seen a 6.00% decline over the last month. It is trading 18% above its 52-week low and 8% below its 52-week high, indicating that small caps are also experiencing a downturn, but not to the extent of the Nasdaq. The negative MACD of -11.3 mirrors the sentiment seen in the Nasdaq, suggesting that small cap stocks are similarly under pressure. The recent daily volume for all three indices is below their longer-term averages, which might hint at a reduced conviction in the current market direction or possibly a wait-and-see attitude among investors.
In summary, all three indices are exhibiting bearish technical signals with negative MACD values and are under moderate selling pressure. However, the Nasdaq's performance indicates a more significant bearish sentiment, possibly reflecting concerns specific to growth and tech sectors. The S&P 500 seems to be faring slightly better on a relative basis, while the Russell 2000's metrics suggest small caps are also facing headwinds. Investors may be adopting a more conservative stance across the board, given these indicators.
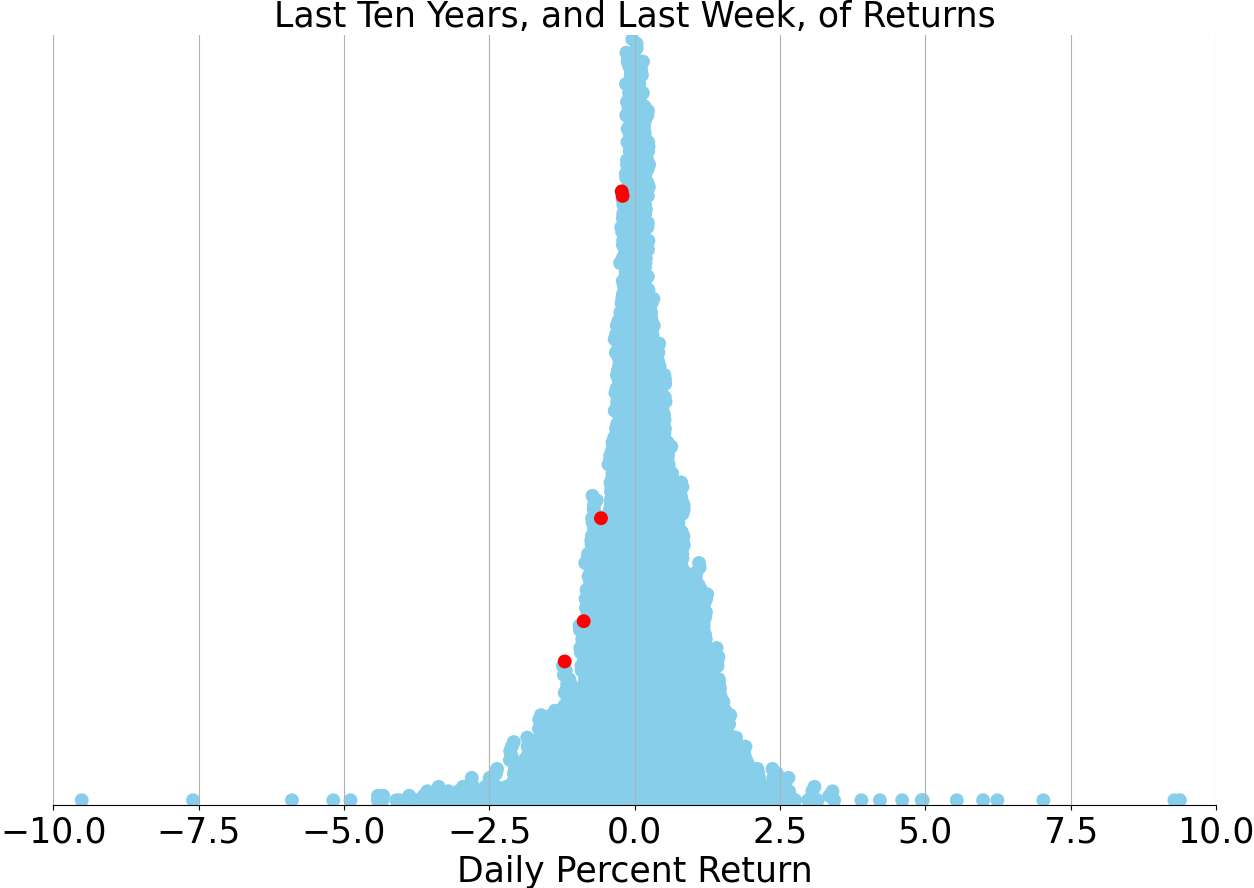
Last week vs. history (Large Cap S&P 500)
Market Commentary
Market Pulse: A Look at the Recent Volatility and Economic Indicators
As the financial landscape navigates through a period of readjustment, investors are witnessing a softening of markets following a robust six-month rally. The S&P 500's significant 25% surge has given way to a more temperate phase, characterized by a natural ebb and flow that often accompanies such vigorous growth. Market corrections, while common, are closely scrutinized for signs of deeper shifts in investor sentiment and economic fundamentals.
In particular, growth stocks and sectors sensitive to interest rates have experienced the most notable pullbacks from their recent peaks. This trend underscores the market's reaction to the changing economic environment, with yields on the 2- and 10-year U.S. Treasury notes climbing in recent months. These movements reflect investor expectations around monetary policy and inflation, key drivers of market behavior.
The fluctuating prices of crude oil and the S&P GSCI Commodity Index also tell a story of a market in transition. After climbing year-to-date, these commodities have recently retreated somewhat. This pullback is attributed to a budding optimism regarding a de-escalation of geopolitical tensions, which could potentially ease supply constraints and pressure on prices.
Looking ahead, sector-specific forecasts for the S&P 500 suggest that utilities, technology, communication services, and consumer discretionary sectors may experience the most robust year-over-year earnings growth in the first quarter of 2024. Such projections are critical for investors seeking to align their portfolios with the most promising areas of growth.
Despite the recent market downturns, the scope of the pullback has remained relatively contained. This moderation aligns with expectations for a period of consolidation or profit-taking after significant gains. The focus now turns to whether this pullback could escalate into a more severe bear market, characterized by extensive drawdowns across various sectors. Current analysis suggests that such a scenario is unlikely for two primary reasons: the underlying economic strength and the absence of systemic risks that typically precede a bear market.
Investors are advised to view this period of volatility as an opportunity to reassess their investment strategies. Implementing tactics such as rebalancing, diversifying, and employing dollar-cost averaging can be prudent approaches to enhancing portfolio resilience. The aim is to position for a potential recovery, which may be spurred by an anticipated environment of lower interest rates in the year ahead.
Historical data provides context for current market dynamics, with the average S&P 500 return in non-recessionary years since 1930 being 9.7%, juxtaposed against an average yearly maximum pullback of 12.8%. While past performance is not indicative of future results, such statistics offer a lens through which to view typical market fluctuations.
The upcoming release of first-quarter GDP and PCE inflation data will be pivotal in shaping market expectations and investment strategies. As the financial community awaits these figures, the importance of robust, data-driven analysis remains paramount. Investors are reminded that while market predictions can never be certain, informed decisions based on comprehensive economic insights are key to navigating the ever-evolving financial terrain.
AI stock picks for the week (Large Cap S&P 500)


