
The Monday Charge: April 1, 2024
As central banks globally hint at upcoming rate cuts, investors and the Federal Reserve alike are cautiously optimistic about the possibility of a soft landing for the economy, reminiscent of the mid-1990s.

This is our Monday article, focusing on the large cap S&P 500 index. Just the information you need to start your investing week. As always, 100% generated by AI and Data Science, informed, objective, unbiased, and data-driven.
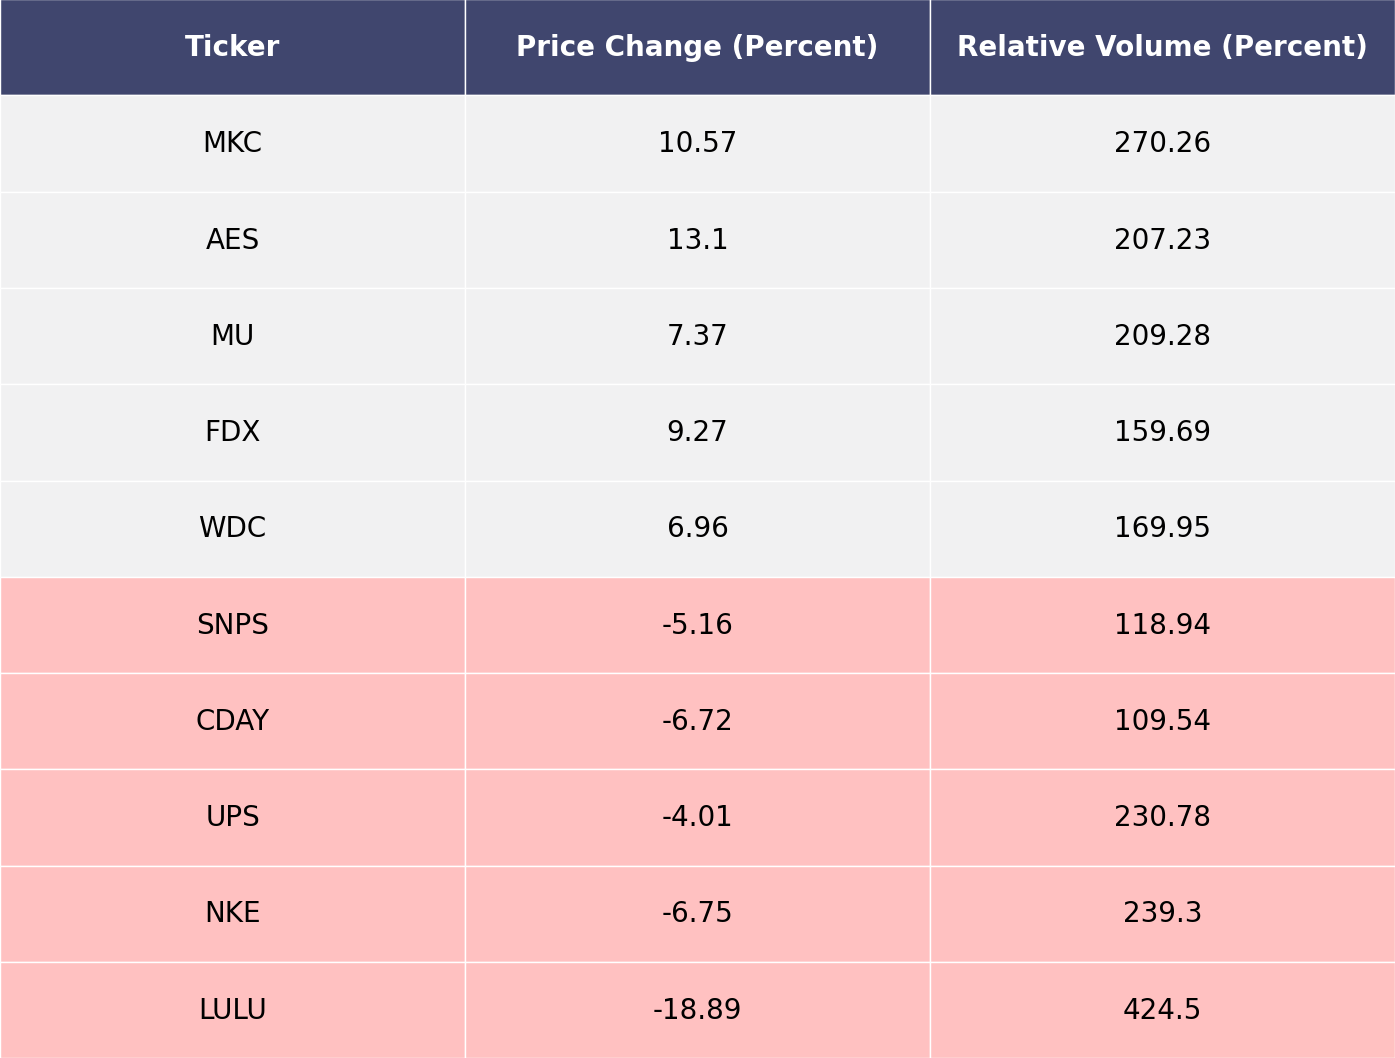
The biggest movers last week on price and volume (Large Cap S&P 500)
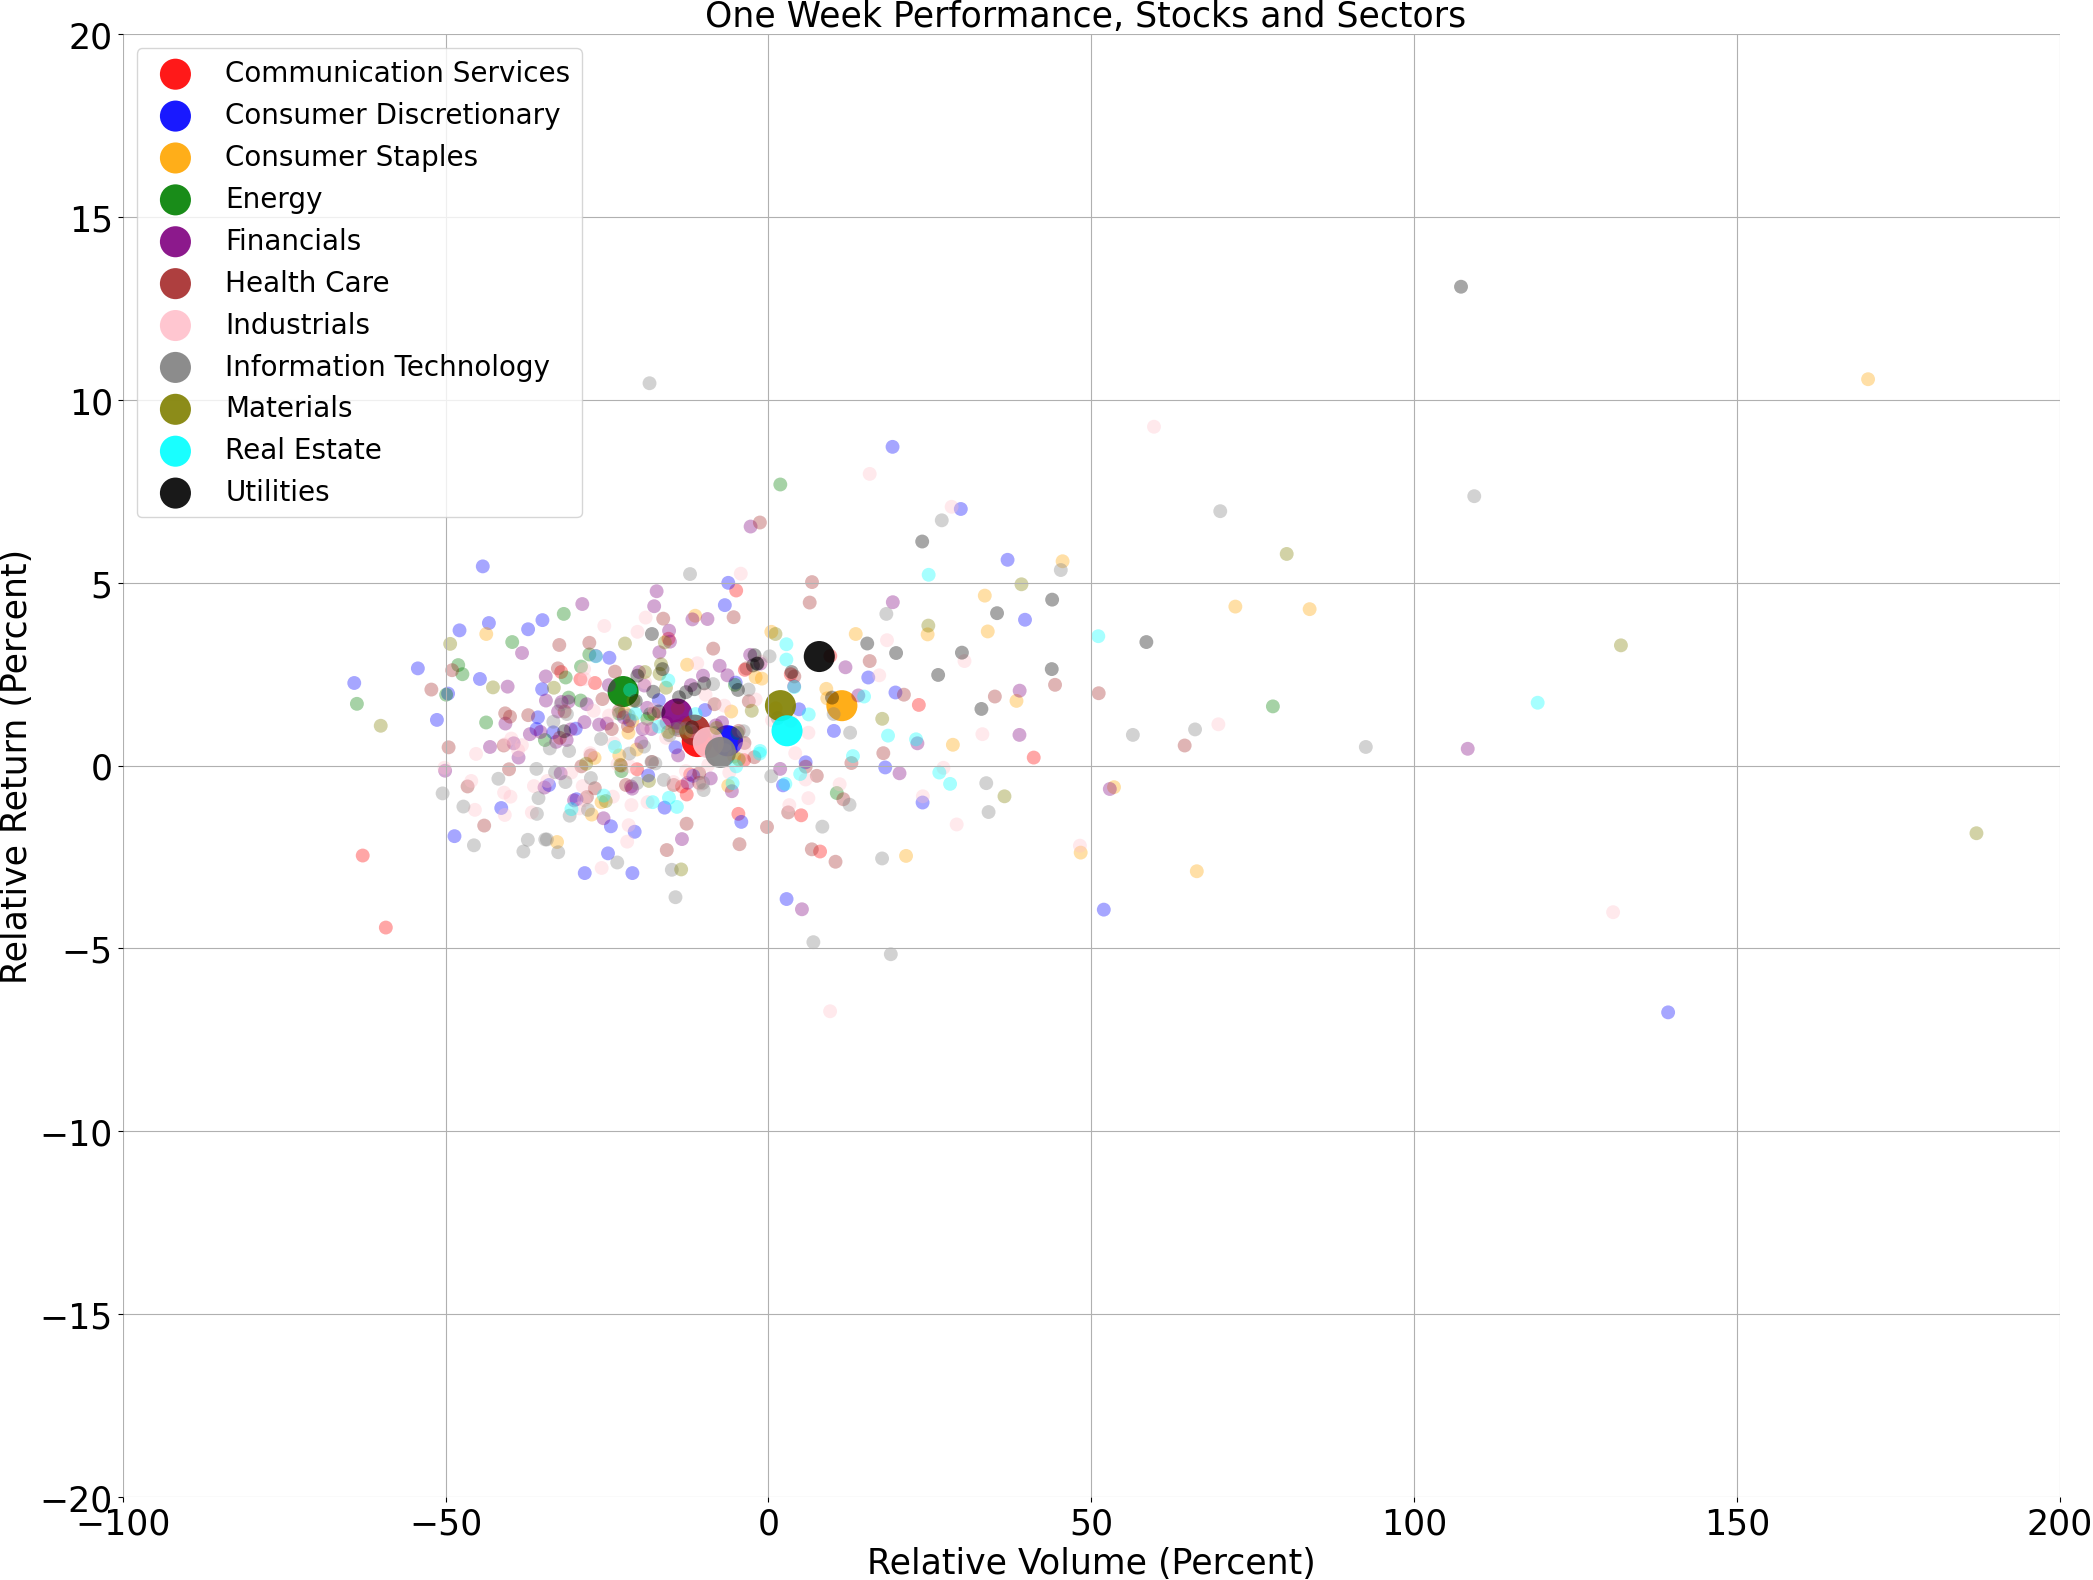
Price and volume moves last week for every stock and sector (Large Cap S&P 500)
A technical analysis across indices
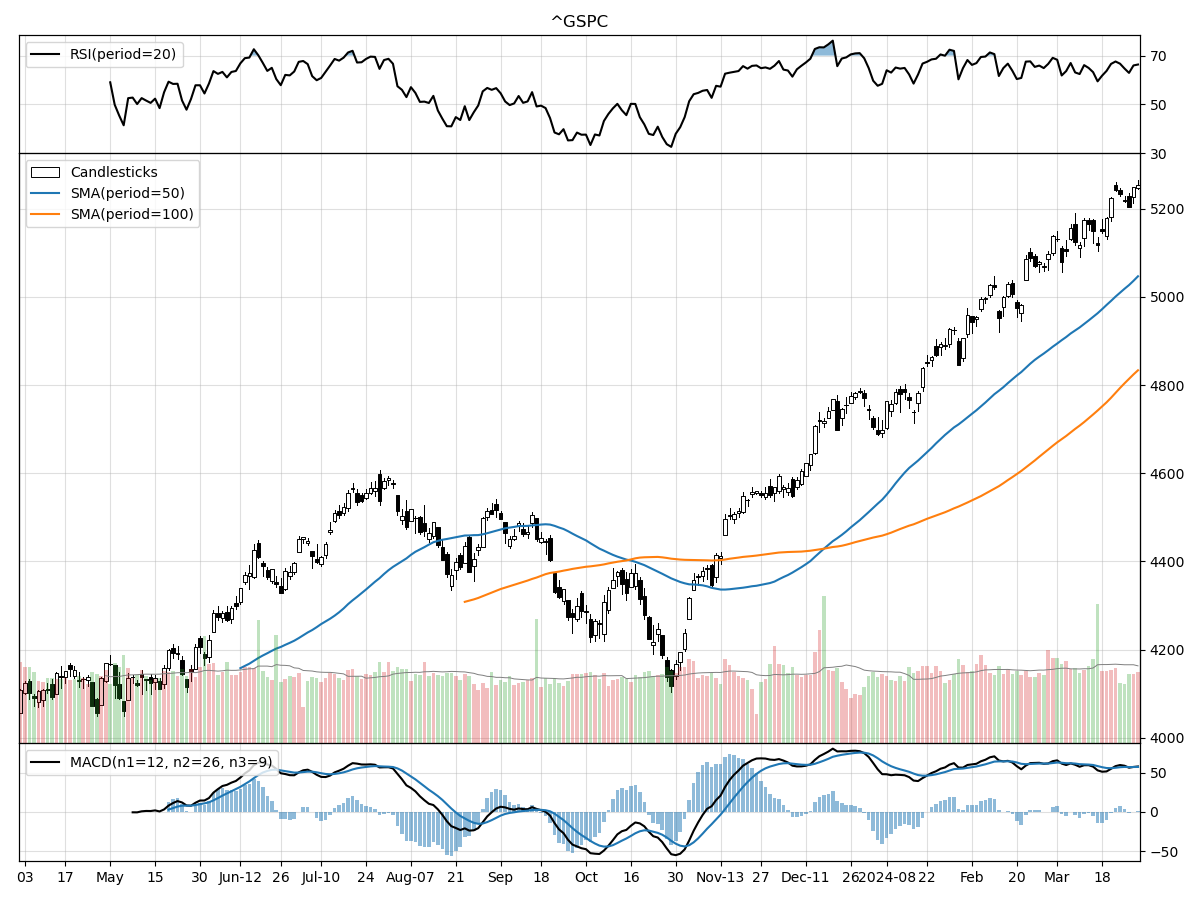
S&P500
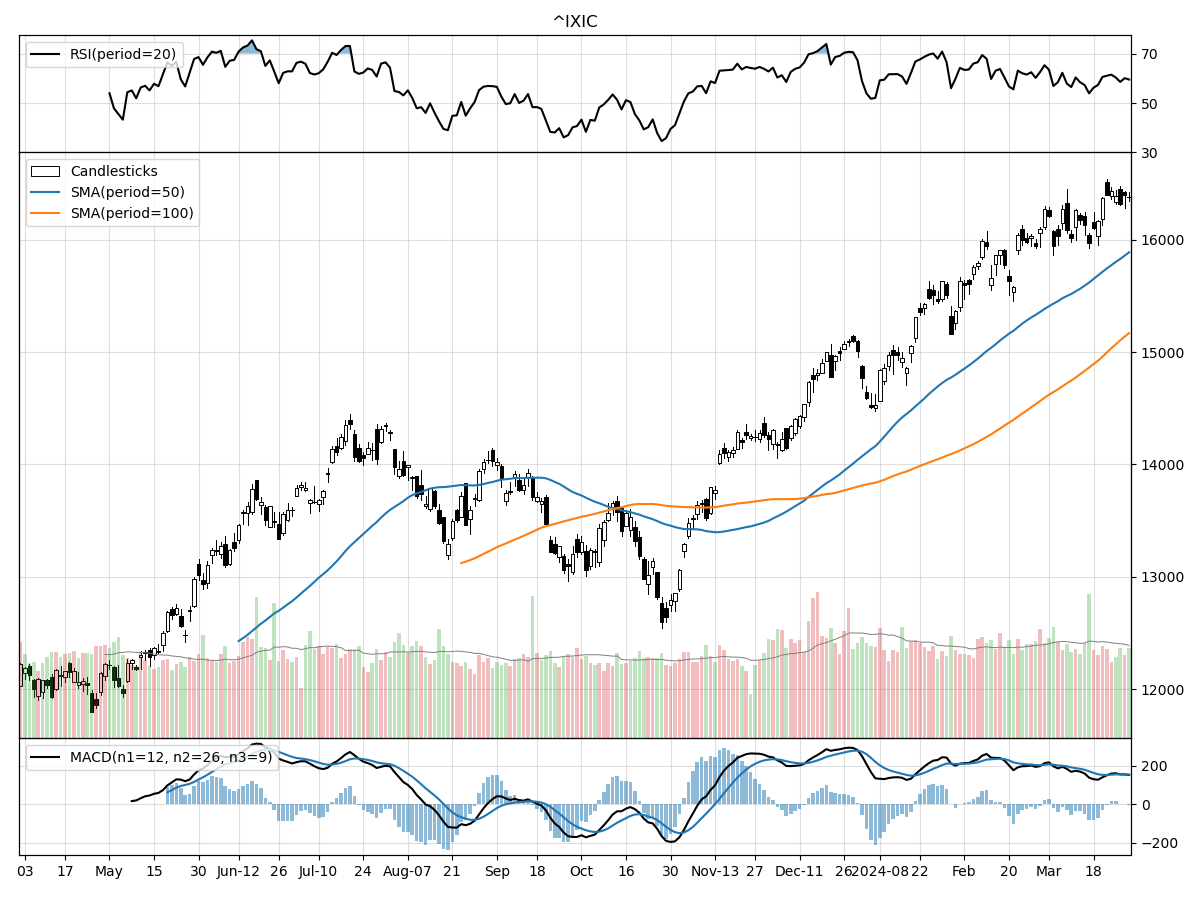
Nasdaq
Russell 2000
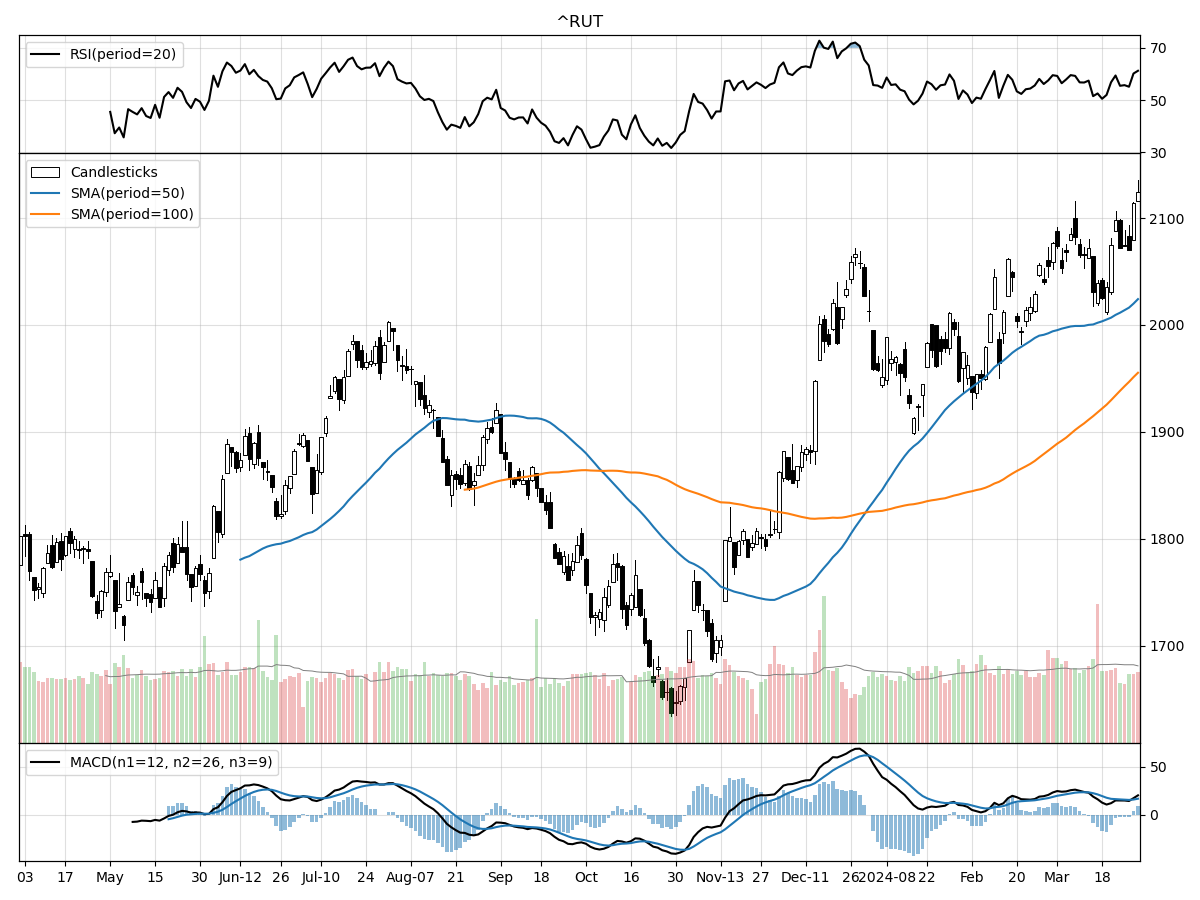
The S&P 500, Nasdaq, and Russell 2000 have experienced notable increases from their 52-week lows, with the Nasdaq leading at 38 percent above its low, compared to 29 percent for both the S&P 500 and Russell 2000. This suggests that the Nasdaq, which is heavily weighted towards technology stocks, has potentially rebounded more strongly from past market downturns or has been less affected by recent adverse market conditions.
All three indices are currently at their 52-week highs, reflecting a possible bullish sentiment among investors. Over the last three months, the Nasdaq and S&P 500 have shown similar growth percentages of approximately 12 percent and 11.68 percent, respectively, while the Russell 2000 has lagged slightly with an 8.44 percent increase, which may indicate that large-cap stocks are currently favored over small-cap stocks.
When it comes to trading volumes, the Nasdaq and Russell 2000 are currently trading above their longer-term average daily volumes, which could be indicative of increased investor interest or higher liquidity in these markets. The S&P 500, while still above its longer-term average, shows a smaller increase in trading volume. Money flow indicators suggest moderate buying pressure for the S&P 500, while the Nasdaq and Russell 2000 are experiencing moderate selling pressure, indicating a divergence in investor sentiment across these indices. Furthermore, the Moving Average Convergence Divergence (MACD) is bullish for all three indices, with the Nasdaq showing a significantly higher value, which might suggest stronger positive momentum among tech stocks.
Overall, while all three indices have shown positive momentum and are at their respective 52-week highs, there are nuances in their performance. The Nasdaq's higher rebound from its low and strong MACD value could be appealing to investors with a focus on growth and technology sectors. Meanwhile, the consistent performance of the S&P 500 and its moderate buying pressure makes it attractive for those seeking a more diversified and stable investment. The Russell 2000's lower relative growth could either be seen as a lagging indicator or as a potential opportunity for investors looking for undervalued small-cap stocks."
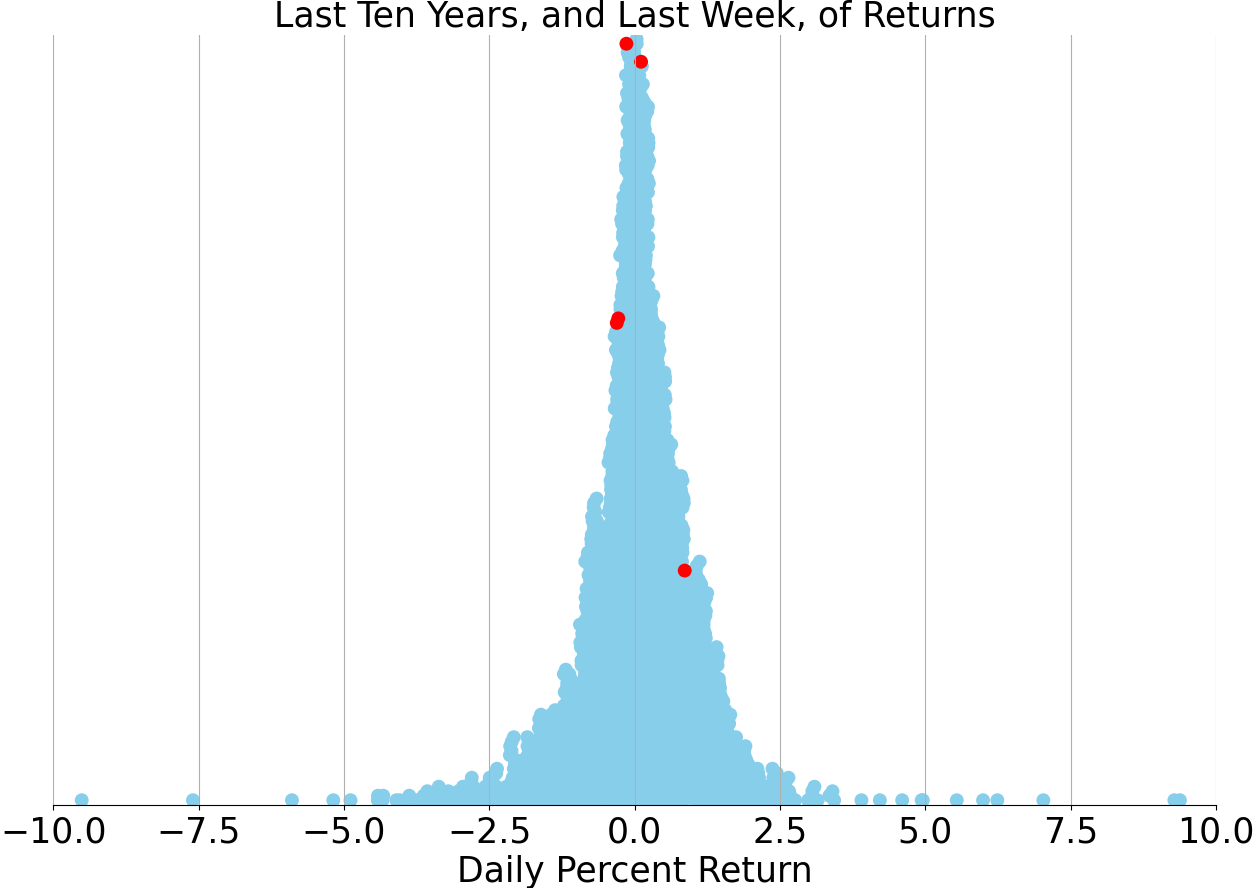
Last week vs. history (Large Cap S&P 500)
Market Commentary
Markets Eye a Repeat of the Mid-'90s Soft Landing Amid Rate Cut Hopes
As central banks globally hint at upcoming rate cuts, investors and the Federal Reserve alike are cautiously optimistic about the possibility of a soft landing for the economy, reminiscent of the mid-1990s. Back then, the Fed's successful transition from a tightening cycle to rate reductions spurred a historic rally in the stock market, with the Dow Jones Industrial Average closing above 5,000 for the first time. This period is now a textbook case of how an economy can emerge from a period of Fed tightening unscathed, avoiding recession while maintaining a strong labor market.
Today, financial conditions appear more supportive than they were two years ago, as indicated by the Bloomberg financial conditions index. This environment could be conducive to a soft landing, similar to the one experienced in the mid-'90s. During that time, a rise in labor productivity played a pivotal role in driving economic growth and controlling inflation. Current data suggests that productivity is again on an upward trajectory, which could help sustain growth and temper inflationary pressures.
However, this influx of liquidity comes with a caveat: the potential fueling of speculative bubbles. A look at the forward price-to-earnings ratio for the S&P 500 and its Equal Weighted counterpart shows that while valuations for mega-cap tech stocks are high, the broader market valuations align more closely with historical norms. Investors are keenly aware of the risks, recalling the S&P 500's impressive returns in the years leading up to the 2000 market peak.
The main threat to the market's tranquility could be an unexpected shift in the inflation outlook. Recent consumer and producer price data have exceeded expectations, and a continued trend could prompt the Fed to reconsider its rate cut strategy. If inflation does not continue its downward trend, the anticipated "last mile" of inflation reduction may become a more prolonged journey, requiring patience from both the Fed and investors.
In the current landscape, our opportunistic portfolio guidance suggests overweighting in U.S. large-cap and mid-cap stocks, maintaining a neutral stance on international large-cap and U.S. small-cap stocks, and underweighting emerging-market equity. For fixed income, we recommend an underweight overall position, with a preference for emerging market debt and a neutral outlook on international bonds and cash.
As we draw parallels between today's market conditions and those of the mid-'90s, there is cautious optimism for a repeat of the soft landing that buoyed markets 30 years ago. Nonetheless, investors should remain vigilant, acknowledging that while history can provide valuable insights, it is not a guarantee of future results. The potential for a Goldilocks scenario exists, but as the iconic Buzz Lightyear's catchphrase goes, one should be wary of expecting to go "To infinity and beyond."
AI stock picks for the week (Large Cap S&P 500)


