
Dime Community Bancshares (DCOM), Mid/Small Cap AI Study of the Week

June 20, 2024
Weekly AI Pick from the S&P 400 or S&P 600
Company Overview
Dime Community Bancshares, Inc. operates as a bank holding company through its subsidiary, Dime Community Bank, offering a variety of commercial and consumer banking services. The company’s portfolio includes commercial real estate loans, residential mortgage loans, consumer loans, and investment securities. Additionally, it provides merchant credit and debit card processing, cash management, and title insurance services through Dime Abstract LLC. A recent merger with Bridge Bancorp, Inc. has expanded its reach to 60 branch locations across Long Island and New York City, enhancing its market presence. With a workforce of 851 full-time employees as of late 2023, the company emphasizes strong community relationships and employee development.
Dime Community Bancshares operates under stringent federal and state regulatory frameworks, which include maintaining specific capital ratios and adhering to safety and soundness standards. The company’s deposit accounts are insured by the FDIC, which also imposes risk-based assessments and minimum capital requirements. Regulatory compliance extends to privacy and cybersecurity measures, with a Chief Information Security Officer overseeing the protection of customer information. The company is also subject to regulations governing transactions with affiliates and insiders, and it must periodically report to and undergo examinations by regulatory bodies such as the NYSDFS and the FRB. Additionally, the company adheres to the Community Reinvestment Act, receiving an "Outstanding" rating in its most recent examination for meeting community credit needs. Compliance with federal laws like the Bank Secrecy Act and the USA PATRIOT Act is crucial for detecting and preventing money laundering and terrorist financing. Despite the regulatory burden, Dime Community Bancshares claims substantial compliance with all relevant laws and regulations, though it acknowledges the potential impact of future regulatory changes on its operations. Investors can access the company’s SEC filings through its website or by direct request.
By the Numbers
- Annual 10-K Report Summary:
- Net income for 2023: $96.1 million (down from $152.6 million in 2022 and $104 million in 2021)
Quarterly 10-Q Report Summary:
- Diluted EPS for Q1 2024: $0.41 (down from $0.92 year-over-year)
- Dividend payout ratio for Q1 2024: 60.98% (up from 26.09% year-over-year)
- Return on average assets for Q1 2024: 0.51% (down from 1.11% year-over-year)
- Return on average equity for Q1 2024: 5.68% (down from 12.50% year-over-year)
- Non-performing loans as of March 31, 2024: $34.8 million (up from $29.1 million at the end of December 2023)
- Total deposits increase for Q1 2024: $368.2 million (compared to $315.8 million increase in Q1 2023)
- Real estate loan originations for Q1 2024: $98.3 million (down from $346.7 million year-over-year)
- C&I loan originations for Q1 2024: $21.1 million (up from $5.2 million year-over-year)
- Tier 1 common equity ratio: 12.8%
- Share repurchases for Q1 2024: None (compared to 24,813 shares at $715 thousand in Q1 2023)
- Dividends paid out in Q1 2024: $1.8 million for preferred stock, $9.7 million for common stock (up from $9.2 million for common stock in Q1 2023)
- Credit loss provision for Q1 2024: $5.2 million (compared to a $3.6 million credit loss recovery in Q1 2023)
- Total assets as of March 31, 2024: $13.50 billion (down by $134.9 million from December 31, 2023)
- Total liabilities as of March 31, 2024: $12.26 billion (down by $148.1 million)
- Stockholders’ equity as of March 31, 2024: $1.24 billion (up by $13.1 million)
- Net income for Q1 2024: $17.7 million (down from $37.3 million in Q1 2023)
- Average total loans for Q1 2024: $10.74 billion
- Allowance for credit losses as of Q1 2024: 0.71%
- Non-performing loans as a percentage of total loans as of Q1 2024: 0.32%
- Net interest income for 2023: $316.57 million (down from $379.86 million in 2022)
- Net interest spread for 2023: 1.49% (down from 2.93% in 2022)
- Net interest margin for 2023: 2.46% (down from 3.25% in 2022)
- Total assets as of December 31, 2023: $13.63 billion (up from $12.47 billion in 2022)
- Interest-bearing liabilities for 2023: $9.01 billion (up from $7.19 billion in 2022)
- Cost of funds for 2023: 3.25% (up from 0.83% in 2022)
- Non-interest-bearing checking accounts: $3.13 billion (down from $3.89 billion)
- Interest income increase for 2023: $170.2 million
- Interest expense increase for 2023: $233.4 million
- Provision for credit losses for 2023: $2.8 million (down from $5.4 million in 2022 and $6.2 million in 2021)
- Non-interest income decrease for 2023: $2.0 million
- Non-interest expenses for 2023: $213.1 million (up by $12.4 million from 2022)
- Income tax expense for 2023: $40.8 million (down by $18.6 million from 2022)
- Stockholders' equity as of December 31, 2023: $1.23 billion (up by $56.6 million)
Stock Performance and Technical Analysis
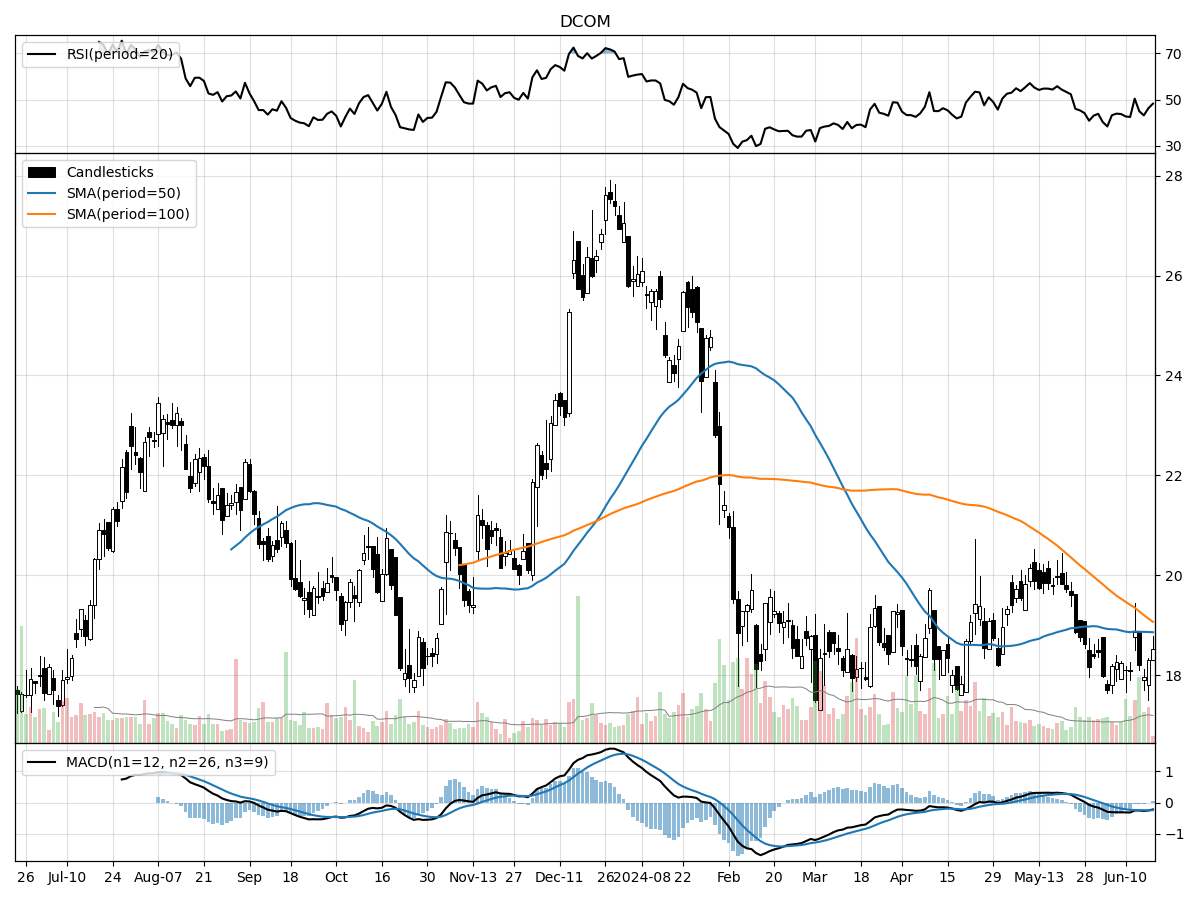
Based on the provided technical indicators, the stock shows a mix of bearish and potentially stabilizing signals. The fact that the current stock price ($18.52) is 6% above its 52-week low but 32% below its 52-week high suggests that the stock has retraced a significant portion of its value from its peak over the last year. This may indicate that the stock has been out of favor with investors or that the company has experienced some negative events affecting its stock price. However, being above the 52-week low could also suggest that the stock is beginning to stabilize or that there is some support preventing further decline.
The decrease of 6.08% in the last month, combined with the relative stability over the last three months, implies that the downward momentum might be slowing down. However, the fact that recent daily volume is lower than the longer-term average volume suggests less trading interest at the current levels, which might limit upward price movements due to a lack of buying pressure.
Regarding the Money Flow indicators, moderate selling pressure and distribution patterns indicate that the stock is experiencing more selling than buying, which usually leads to a decrease in price. This is further supported by the Moving Average Convergence Divergence (MACD), which is bearish at -0.24. The MACD is a trend-following momentum indicator that shows the relationship between two moving averages of a stock's price. A negative MACD indicates that the short-term average is below the long-term average, signaling downward momentum and a bearish outlook for the stock.
In conclusion, the bearish MACD, the stock's position relative to its 52-week high and low, and the current selling pressure suggest caution for investors considering this stock. While the recent price stability might be appealing, the lack of strong buying volume and ongoing distribution could continue to weigh on the stock price. A prudent approach would be to wait for more definitive bullish signals, such as increased volume on up days, a bullish crossover in the MACD, or other indicators that suggest a reversal of the current downtrend before considering an investment.

The ‘Bull’ Perspective
Summary:
- Robust Regulatory Capital Position: DCOM maintains a strong Tier 1 common equity ratio of 12.8%, well above the regulatory requirement, indicating a solid capital buffer and financial stability.
- Strategic Deposit Growth: A significant increase of $368.2 million in business deposits reflects DCOM's successful growth strategy and its ability to attract and retain customers.
- Diversified Loan Portfolio: Despite a decrease in real estate loan originations, DCOM has witnessed an uptick in commercial and industrial (C&I) loan originations, showcasing diversification and adaptability in its lending strategy.
- Prudent Risk Management: The company's proactive measures, including a $5.2 million credit loss provision, demonstrate a forward-looking approach to risk management amid a complex lending environment.
- Favorable Economic Outlook: With the Federal Reserve signaling a potential soft landing for the U.S. economy and a gradual reduction in interest rates, DCOM stands to benefit from lower borrowing costs and a supportive economic backdrop.
1. Robust Regulatory Capital Position:
Dime Community Bancshares' Tier 1 common equity ratio of 12.8% is a testament to its financial resilience. This robust capital position not only meets but exceeds the "well-capitalized" threshold set by regulatory agencies, ensuring that DCOM can withstand economic fluctuations. In a landscape where regulatory scrutiny is intensifying, DCOM's capital adequacy is a significant asset, providing investors with reassurance about the company's ability to manage potential losses and continue its growth trajectory.
2. Strategic Deposit Growth:
The impressive growth in business deposits, totaling $368.2 million, underscores DCOM's ability to execute its deposit-gathering strategies effectively. This growth is indicative of the bank's strong relationships with its business clients and its competitive positioning in the market. Such an increase in deposits enhances the company's liquidity profile and provides a stable funding source for future lending activities, which is crucial in a period where the industry is facing tightening margins due to fluctuating interest rates.
3. Diversified Loan Portfolio:
DCOM's shift in focus from real estate to an increase in C&I loan originations, which rose from $5.2 million to $21.1 million, illustrates strategic portfolio diversification. This move not only mitigates the risk associated with a concentration in real estate lending but also positions the company to capitalize on different market opportunities. The diversification into C&I loans can potentially lead to higher yields and offers a buffer against the volatility in the real estate market.
4. Prudent Risk Management:
The allocation of a $5.2 million credit loss provision, particularly directed towards the multifamily loan portfolio, reflects DCOM's prudent approach to risk management. By proactively setting aside funds for potential credit losses, the company is preparing for any adverse economic conditions that may impact its loan portfolio. This conservative stance on provisioning is a strategic move that protects the bank's balance sheet and investor interests in times of economic uncertainty.
5. Favorable Economic Outlook:
Recent signals from the Federal Reserve suggest that the U.S. economy may be headed towards a "soft landing," with expectations of GDP growth remaining stable and inflation projected to decrease to the Fed's 2.0% target by 2026. For DCOM, this economic outlook could translate into lower borrowing costs and a more favorable interest rate environment. As the Fed contemplates a reduction in interest rates, DCOM may benefit from improved net interest margins and increased demand for loans, bolstering its financial performance and enhancing shareholder value.
In conclusion, while DCOM has faced challenges, the company's strong capital position, strategic growth in deposits, diversified loan portfolio, proactive risk management, and the broader favorable economic conditions paint a picture of resilience and potential for investors. DCOM's ability to navigate the complexities of the current economic landscape, coupled with the Federal Reserve's outlook for a soft landing, positions the bank as a potentially attractive investment opportunity for those looking to capitalize on the evolving financial sector.

The ‘Bear’ Perspective
Summary:
- Earnings Decline: DCOM's diluted EPS plummeted from $0.92 to $0.41 year-over-year, indicating a substantial drop in profitability.
- Rising Credit Risks: Non-performing loans surged to $34.8 million, with a significant increase in loans 60 to 89 days past due, from $1.3 million to $25.2 million, suggesting deteriorating loan quality.
- Interest Rate Sensitivity: With the Federal Reserve's monetary policy tightening, DCOM's net interest income is under pressure, which could further squeeze margins.
- Regulatory and Operational Challenges: Compliance failures and operational risks could lead to significant financial and reputational damage.
- Market Conditions and Competition: The recent softer inflation readings may prompt the Fed to cut rates, which could result in lower net interest margins for banks like DCOM, while intense competition in Greater Long Island and Manhattan could limit growth.
Elaboration:
- Earnings Decline
DCOM's earnings have shown a worrying contraction, with diluted EPS nearly halving from the previous year. This steep decline from $0.92 to $0.41 is not just a reflection of cyclical headwinds but points to deeper issues in the company's core business model. The dividend payout ratio's increase to 60.98% is particularly concerning, as it may not be sustainable in the long term without stable or growing earnings. Moreover, the return on average assets and equity's fall to 0.51% and 5.68%, respectively, from the previous year's 1.11% and 12.50%, raises questions about the company's efficiency in utilizing its assets and equity base to generate profits. - Rising Credit Risks
The increase in non-performing loans to $34.8 million, coupled with a sharp rise in past-due loans, signals a potential uptick in credit losses. The shift from a $3.6 million credit loss recovery to a $5.2 million provision for credit losses, particularly within the multifamily loan portfolio, indicates that DCOM is bracing for more defaults. This trend could lead to higher provisions in future quarters, which would further erode earnings. The increase in loans 60 to 89 days past due from $1.3 million to $25.2 million is alarming, as it points to an emerging pattern of delinquency that could forecast future credit quality issues. - Interest Rate Sensitivity
DCOM's performance is highly sensitive to interest rate fluctuations. With the Federal Reserve's current tightening cycle, there is a risk that net interest income could face further compression. As rates rise, DCOM's interest expense may increase faster than its interest income, especially if loan demand weakens or if there is a shift towards lower-yielding assets. This scenario could lead to a contraction in the net interest margin, which would have a direct impact on profitability. - Regulatory and Operational Challenges
Regulatory scrutiny and operational risks pose significant threats to DCOM. Compliance with fair lending laws, environmental liabilities, and anti-money laundering regulations are areas where lapses could lead to hefty penalties and erode investor confidence. Additionally, operational risks such as system failures, security breaches, and fraud could lead to unforeseen costs and damage the company's reputation. These challenges, if not managed effectively, could have a material adverse effect on financial performance. - Market Conditions and Competition
The macroeconomic environment and competitive landscape present formidable headwinds for DCOM. While recent lower-than-expected inflation readings may signal a potential for rate cuts by the Fed, this could also lead to narrower net interest margins for banks. Furthermore, the competitive pressure in DCOM's primary markets of Greater Long Island and Manhattan is intense, with competitors potentially offering more attractive loan terms. This competition could constrain DCOM's ability to grow its loan portfolio and maintain profitability.
In conclusion, DCOM's recent financial performance, rising credit risks, sensitivity to interest rate changes, regulatory and operational challenges, and competitive pressures create a compelling bearish case. Investors should exercise caution, as the stock may face downward pressure due to these factors.


Comments ()