
Brighthouse Financial, Inc. (BHF), Mid/Small Cap AI Study of the Week

June 6, 2024
Weekly AI Pick from the S&P 400 or S&P 600
Company Overview
Brighthouse Financial, Inc. (BHF) is a prominent U.S. provider of annuity and life insurance products, managing over 2.3 million contracts and policies as of December 31, 2023. The company operates through subsidiaries such as Brighthouse Life Insurance Company, Brighthouse Life Insurance Company of NY (BHNY), and New England Life Insurance Company (NELICO), although NELICO is not currently writing new business. Brighthouse emphasizes financial discipline, independent distribution, and capitalizes on demographic trends to drive demand for its offerings. The company is organized into three segments: Annuities, Life, and Run-off, with a primary focus on the U.S. market. Key products include variable annuities, Shield Annuities, fixed deferred annuities, and income annuities, with innovations like Shield Annuities and Fixed Indexed Annuities (FIAs) bolstering growth and market relevance.
Brighthouse Financial's revenue generation mainly comes from fees associated with annuity contracts, such as mortality and expense fees, administrative fees, and investment management fees. Their core product, variable annuities, offers tax-deferred wealth accumulation with various investment options, where contract holders bear most investment risks unless they choose guaranteed minimum benefits (GMxBs). The company has refined its product offerings, focusing on guarantees and claims costs, and has introduced new products like Brighthouse SmartCare® and Brighthouse SmartGuard Plus® to enhance policyholder benefits. These new products, launched in 2019 and 2023 respectively, integrate long-term care options and guaranteed distribution riders into universal life insurance offerings, positioning Brighthouse for future revenue and profit growth. Additionally, Brighthouse manages a Run-off segment for products no longer actively sold and employs reinsurance strategies to manage risks and support growth. The company's life insurance segment includes term, universal, whole, and variable life products, with a focus on term life and universal life with index-linked benefits.
By the Numbers
Annual 10-K Report Summary (2023):
- Net loss: $1.2 billion in 2023, compared to net income of $3.8 billion in 2022.
- Adjusted earnings: $969 million in 2023, down from $1.2 billion in 2022.
- Derivatives exposure: Gross notional amount increased to $73.142 billion in 2023 from $47.866 billion in 2022.
- Derivatives fair value: $150 million in assets and $2.094 billion in liabilities in 2023; $95 million in assets and $2.665 billion in liabilities in 2022.
- RBC ratio target: 400-450% under normal market conditions.
- CTE98 levels: Maintained assets at or above these levels.
- Decrease in ULSG liabilities: $259 million due to updated long-term general account earned rate assumptions.
- MRBs fair value adjustments: Quarterly, affecting net income and OCI.
Quarterly 10-Q Report Summary (Q1 2024):
- Net loss available to shareholders: $519 million in Q1 2024, compared to $525 million in Q1 2023.
- Adjusted loss: $98 million in Q1 2024, compared to adjusted earnings of $195 million in Q1 2023.
- Total revenues: $74 million in Q1 2024, down from $1,284 million in Q1 2023.
- Total expenses: $688 million in Q1 2024, down from $1,937 million in Q1 2023.
- Effective tax rate: Decreased to 20% in Q1 2024 from 24% in Q1 2023.
- Loss before provision for income tax: $642 million in Q1 2024, an improvement from $681 million in Q1 2023.
- Annuities segment adjusted earnings: $313 million in Q1 2024, down $1 million from Q1 2023.
- Life segment adjusted loss: $36 million in Q1 2024, a $37 million reduction from Q1 2023.
- Run-off segment adjusted loss: $341 million in Q1 2024, worsened from $106 million in Q1 2023.
- Corporate & Other adjusted loss: $34 million in Q1 2024, increased by $20 million from Q1 2023.
Stock Performance and Technical Analysis
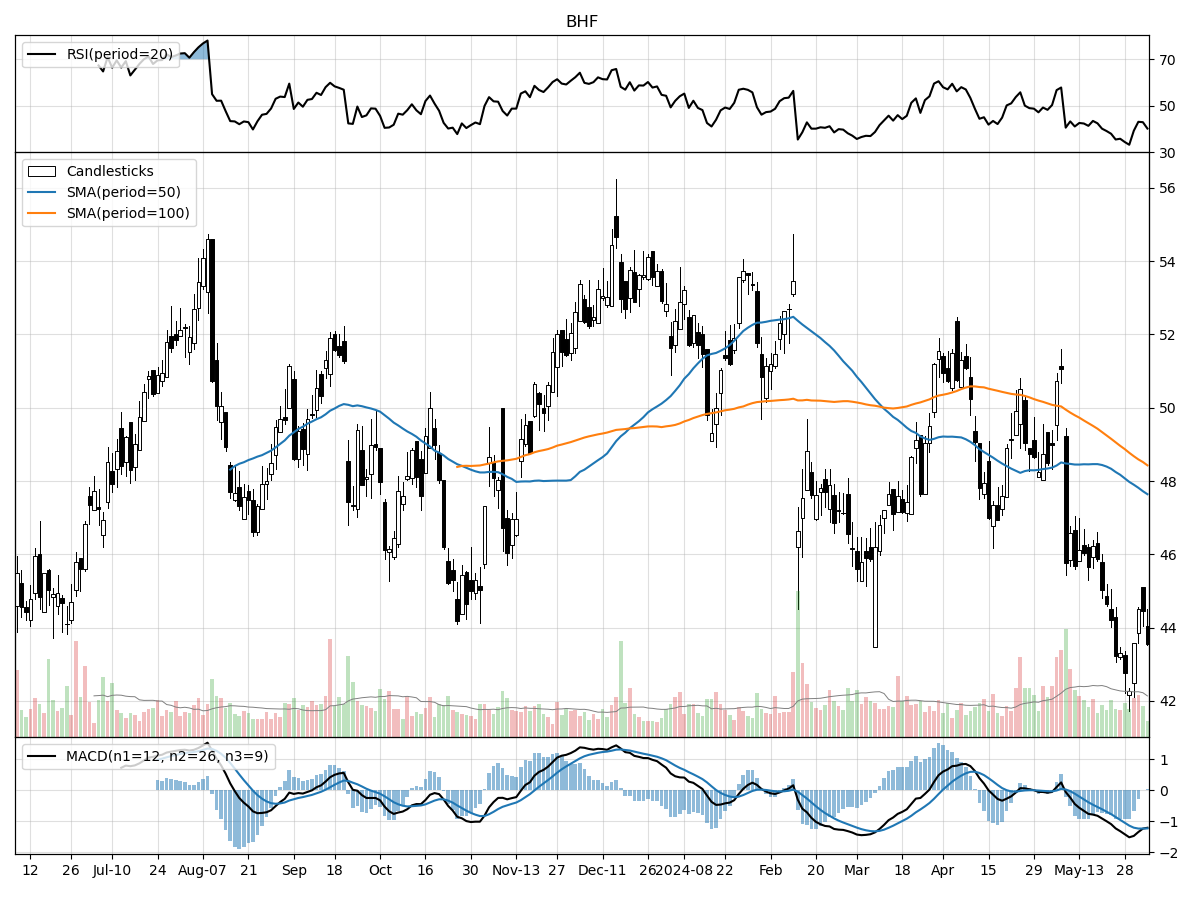
As a stock analyst examining the current technical indicators for the stock priced at $43.55, several data points stand out that may influence an investment decision. The stock is currently trading 3% above its 52-week low and 20% below its 52-week high, indicating that the stock is closer to the lower end of its yearly range. This could suggest that the stock is undervalued, presenting a potential buying opportunity if the fundamentals are sound. However, this must be weighed against the negative momentum it has shown recently, with a drop of approximately 14.73% in the last month and a decline of 6.93% over the last three months. This downtrend could signal that the stock is not yet ready for a reversal, especially in the absence of a catalyst or a change in market sentiment.
Volume analysis shows a recent daily trading volume of around 500,690.9 shares, which exceeds the longer-term average of 416,998.88 shares per day. Typically, an increase in trading volume can indicate heightened interest in the stock, but this should be interpreted in the context of other indicators. The Money Flow indicators suggest that the stock is under moderate selling pressure and is experiencing distribution, meaning that more investors are selling their shares than buying, potentially driving the price down further.
Looking at the Moving Average Convergence Divergence (MACD), the bearish signal at -1.22 corroborates the selling pressure indicated by the Money Flow. The MACD is a trend-following momentum indicator that shows the relationship between two moving averages of a stock's price. A negative MACD value indicates that the short-term average is below the long-term average, suggesting downward price momentum and reinforcing the case for a bearish outlook in the short term.
In conclusion, the technical indicators suggest that the stock is in a downtrend with ongoing selling pressure, as evidenced by the negative MACD and Money Flow indicators. While the stock's current price relative to its 52-week range could be enticing for value investors, the negative momentum and distribution signs imply that caution is warranted. It may be prudent to wait for signs of a trend reversal, such as a bullish MACD crossover or a shift in Money Flow to accumulation before considering an entry point. As always, technical analysis should be complemented with a thorough review of the company's fundamentals and market conditions to make a well-informed investment decision.

The ‘Bull’ Perspective
Summary:
- Robust Annuities Segment: Despite a marginal decline, BHF's annuities segment remains profitable with adjusted earnings of $313 million, indicating stable demand for its products.
- Improving Loss Metrics: Year-over-year improvements in net loss figures and reduced expenses signal a potential turnaround in financial performance.
- Strategic Hedging and Reinsurance: BHF's strategic use of derivatives and reinsurance, while risky, has the potential to stabilize long-term profitability.
- Market Position and Diversification: BHF's established market position and ongoing efforts to diversify its product portfolio could lead to increased market share and profitability.
- Valuation Opportunity: Current market volatility and interest rate fears have led to an undervaluation of BHF's stock, presenting a potential buying opportunity for long-term investors.
Elaboration:
1. Robust Annuities Segment
Brighthouse Financial's annuities segment is a cornerstone of its business, generating $313 million in adjusted earnings in the latest quarter. Although this is a slight decrease from the previous year, it represents a solid performance in a challenging economic environment marked by increased market volatility and interest rate changes. The annuity business is typically resilient, as it provides policyholders with long-term financial security, which remains attractive in uncertain times. BHF's ability to maintain profitability here is a testament to its competitive product offerings and strong customer relationships.
2. Improving Loss Metrics
The recent earnings report from BHF shows a year-over-year improvement in net loss figures, with a reduction in total losses from $525 million to $519 million. Total expenses also saw a significant decrease, dropping from $1,937 million to $688 million. While the numbers still reflect a loss, the trajectory is positive, indicating that BHF is on a path to better financial health. The company's proactive steps to manage costs and improve operational efficiency are likely to bear fruit, potentially leading to a return to profitability in the near future.
3. Strategic Hedging and Reinsurance
BHF employs a sophisticated risk management strategy that includes the use of derivatives and reinsurance to mitigate the inherent risks in its business, such as market fluctuations and interest rate changes. While these strategies come with their own set of risks, including counterparty risk and the potential for ineffective hedging, they are crucial for protecting the company's balance sheet against adverse events. If executed correctly, these strategies can smooth out earnings volatility and protect capital, which is critical for maintaining investor confidence and ensuring long-term sustainability.
4. Market Position and Diversification
With a strong presence in the annuities and life insurance markets, BHF has a well-established position that can serve as a platform for growth. The company's efforts to diversify its product offerings, including a focus on different types of annuities and life insurance products, could help capture additional market share. Diversification not only helps spread risk but also allows BHF to capitalize on different market segments, potentially boosting overall profitability. Furthermore, BHF's established brand and distribution network provide a competitive advantage that can be leveraged to drive sales even in a challenging economic climate.
5. Valuation Opportunity
The recent market downturn, spurred by fears of interest rate hikes and inflation, has led to a broad sell-off in financial stocks, including BHF. This has resulted in a potential undervaluation of BHF's shares, offering an attractive entry point for investors with a long-term perspective. While the company faces significant challenges, its current stock price may not fully reflect its intrinsic value, especially considering its solid annuities segment and improving loss metrics. For investors willing to weather short-term volatility, BHF presents a compelling opportunity to buy into a company with a path to recovery at a discounted price.
In conclusion, Brighthouse Financial, Inc. presents a nuanced investment opportunity. While the company navigates through a period marked by economic uncertainty and market volatility, the underlying strengths in its annuities business, improving loss metrics, and strategic risk management initiatives speak to its resilience. With a keen eye on valuation and a long-term investment horizon, BHF's current position could represent a strategic addition to a diversified investment portfolio.

The ‘Bear’ Perspective
Summary:
- Significant Q1 Losses: BHF reported a substantial net loss of $519 million in Q1 2024, with a worrying trend of deteriorating adjusted earnings, now at a $98 million loss.
- Market and Interest Rate Vulnerabilities: The company is highly susceptible to market volatility and interest rate changes, which have already led to unfavorable valuation changes and investment losses.
- Sector Performance and Economic Headwinds: Given the current economic climate, BHF's performance in the life insurance and annuities sector is under pressure, compounded by broader market trends and potential Fed rate hikes.
- Investment Portfolio Risks: The investment portfolio is showing signs of strain under the current interest rate environment, with implications for future unrealized losses.
- Regulatory and Operation Risks: Regulatory changes and operational challenges pose additional threats to BHF's stability and profitability.
Elaboration:
- Substantial Net Losses:
Brighthouse Financial's first quarter of 2024 has been challenging, to say the least. The reported net loss of $519 million is a stark reminder of the company's financial struggles, only marginally better than the $525 million loss from the previous year. Adjusted earnings have taken a significant hit, sliding from a profitable $195 million in Q1 2023 to a loss of $98 million in Q1 2024. This downward trajectory is alarming and suggests that the company's strategies are not effectively combating the current financial headwinds. Investors should be wary of this pattern of losses, as it may indicate deeper underlying issues that could continue to drag on the company's financial performance. - Market and Interest Rate Vulnerabilities:
Brighthouse Financial's sensitivity to market swings and interest rate fluctuations is a considerable liability. The company's recent financial woes are partly due to adverse changes in the estimated fair value of variable annuity guaranteed benefit riders and interest rate derivatives. With the Federal Reserve's rate hikes and persistent inflation, BHF's annuity products and investment returns are under threat. The company's ability to attract and retain customers for its insurance products may be compromised, and the potential for further rate increases could exacerbate existing investment losses. - Sector Performance and Economic Headwinds:
The life insurance and annuities sector is facing a multitude of challenges, and BHF is not immune. The company's Annuities and Life segments have seen declines in adjusted earnings, with the Annuities segment slightly down by $1 million to $313 million and the Life segment reporting a troubling adjusted loss of $36 million. These figures reflect the broader economic pressures, including a potential Fed rate cut and the AI mania's impact on the market. Additionally, the low intra-year pullback in the S&P 500 Index at 5.5% in 2024, compared to historical standards, suggests that investors may be overlooking latent market risks that could affect companies like BHF. - Investment Portfolio Risks:
BHF's investment portfolio is already showing signs of distress, with net unrealized losses that could deepen if interest rates continue to rise. The company's exposure to commercial real estate is particularly concerning, as shifts toward hybrid work arrangements could affect the value of these assets. Moreover, the performance of the investment portfolio has been lackluster, with the potential for further declines in fixed maturity securities and mortgage loans. Investors should be cautious of the company's investment strategies, which may not be robust enough to withstand ongoing market turbulence. - Regulatory and Operation Risks:
The regulatory landscape is ever-changing, and BHF must navigate this with caution. New standards from the FASB could unfavorably impact the company's financial statements and shareholder equity. Additionally, operational challenges, such as the reliance on dividends from subsidiaries and the need to comply with debt agreements, could trigger defaults and further financial instability. The risks associated with reinsurance reliance and the performance of third-party service providers also add layers of uncertainty to BHF's outlook.
In conclusion, Brighthouse Financial, Inc. presents a concerning picture for potential investors. The combination of significant losses, market and interest rate sensitivities, sector headwinds, portfolio risks, and regulatory challenges paints a bearish outlook for the company. Prudent investors should carefully consider these factors and the potential for further financial deterioration before making any investment decisions regarding BHF stock.


Comments ()