
United Airlines Holdings, Inc. (UAL), Large Cap Study of the Week
S&P500, November 7, 2023
(Reminder that our AI algorithm pick stocks based on projected performance over the next three months)
Company Overview
United Airlines Holdings, Inc. is a major airline that operates both domestically and internationally through its subsidiary, United Airlines. The company has a substantial route network across North America and also participates in the cargo transport sector, delivering to various global destinations. United Airlines is currently focusing on strategic growth through its United Next initiative, which includes a significant combined aircraft order. Additionally, United Airlines operates a regional flight network through its United Express brand and is part of the Star Alliance.
The company operates in the aviation sector, offering passenger and cargo travel services. It has several joint business arrangements with other airlines, such as Lufthansa Group, ANA, Air New Zealand, and Air Canada, which enhance its service offerings and customer benefits. United Airlines also has a loyalty program, MileagePlus, which generates revenue through partnerships with companies like JPMorgan Chase Bank. The company has diversified into other services like air cargo, maintenance services, and flight academy, which provide additional revenue streams.
United Airlines is also committed to environmental sustainability, with a goal to achieve net-zero greenhouse gas emissions by 2050. It has implemented strategies to reduce its carbon footprint, including investing in sustainable aviation fuel and replacing its fleet with more fuel-efficient aircraft. Additionally, the company has invested in early-stage climate technology companies through its corporate venture capital arm, United Airlines Ventures.
United Airlines has also ventured into new business areas like the United Aviate Academy, a pilot training school aimed at diversifying the aviation industry. This venture not only provides a steady flow of trained pilots for its operations but also contributes to the company's commitment to diversity. Through other programs like 'Calibrate', United is providing career alternatives for underrepresented groups in the aviation industry.
By the Numbers
- Operating revenue increased from $24,634 million in 2021 to $44,955 million in 2022, nearing the pre-pandemic revenue of $43,259 million in 2019.
- Net income swung from a loss of $1,964 million in 2021 to a profit of $737 million in 2022.
- Operating expenses grew from $25,656 million in 2021 to $42,618 million in 2022.
- Aircraft fuel expenses increased by 127.9% from 2021 to $13,113 million in 2022.
- Salaries/related costs increased by 19.9% from 2021 to $11,466 million in 2022.
- Passenger revenue increased by 98.2% from 2021, but cargo revenue decreased by 7.6% compared to 2021.
- Unrestricted cash and short-term investments were $16.4 billion, down by $2 billion from 2021.
- Debt and other financial liabilities were $37.3 billion, with $3.6 billion due in the next 12 months.
- Gross capital expenditures expected in 2023 are approximately $8.5 billion.
- Cash flow from operating activities was $6,066 million for 2022.
- Net use of cash from investing activities was $13,829 million in 2022.
- Principal payments on debt, finance leases, and other financing liabilities were $4.0 billion in 2022.
- Borrowed $0.8 billion for aircraft financings in 2022.
- Future cash requirements total between $15.0 and $18.4 billion for years 2023 to 2027, and a long-term total of $40.3 billion after 2027.
- Long-term debt peaks at $5.2 billion due in 2026 and totals $13.7 billion after 2027.
- Deferred tax asset as of December 31, 2022, was $7.5 billion.
- Q3 2023 net income was $1.1 billion, up from $942 million in Q3 2022.
- Operating income for Q3 2023 was $1.7 billion, up from $1.5 billion in Q3 2022.
- Operating revenue for Q3 2023 was $14.484 billion, a 12.5% increase YOY.
- Operating expenses for Q3 2023 were $12.745 billion, up by 11.6% YOY.
- Passenger revenue for Q3 2023 increased by 14.6% to $13.349 billion.
- Cargo revenue decreased by 33.1% to $333 million in Q3 2023.
- Nonoperating expenses increased by 16.7% to $254 million in Q3 2023.
- Cash and cash equivalents reached $17.1 billion, up from $16.4 billion at the end of 2022.
- Debt and financial liabilities were $19.7 billion as of September 30, 2023, including $4.6 billion due within a year.
- Total increase in cash of $7,695 million through nine months ended September 30, 2023.
- CASM (GAAP) figures for the three months ended September 30, 2023 and 2022 were 16.27 and 16.87 respectively.
- CASM (GAAP) figures for the nine months ended September 30, 2023 and 2022 were 16.95 and 17.21 respectively.
Stock Performance and Technical Analysis
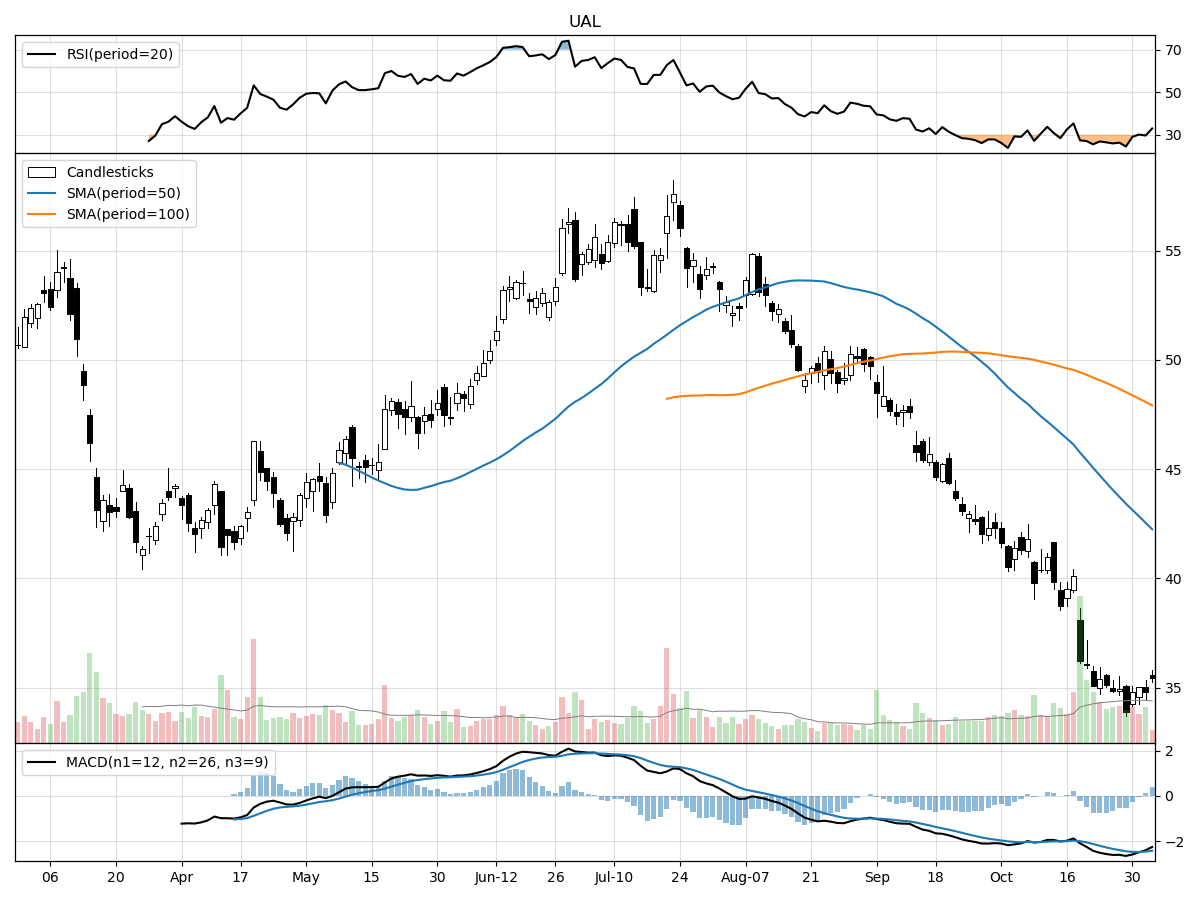
Analyzing the technicals, it is evident that the stock is currently trading at $35.45, which is 4% above its 52-week low, indicating a slight recovery from its lowest point. However, it is crucial to note that the stock is trading 60% below its 52-week high, which could potentially signal that the stock is significantly undervalued. Additionally, the stock's daily trading volume has been higher than its longer-term average, suggesting increased interest from investors.
The stock's MACD (Moving Average Convergence Divergence) is currently at -2.41, displaying a bearish trend. The MACD is a trend-following momentum indicator that shows the relationship between two moving averages of a security's price. A negative MACD indicates that the short-term average is below the long-term average, signifying downward momentum. This could imply that it may not be the best time to invest, as the stock might continue to decline.
Furthermore, the money flow indicators suggest that the stock is under moderate selling pressure and is being distributed. This means that more people are selling the stock than buying it, leading to a decrease in its price. Money Flow Index (MFI) is an oscillator that uses both price and volume to measure buying and selling pressure. A high MFI indicates buying pressure, while a low one suggests selling pressure. The current situation could indicate a bearish market sentiment towards the stock.
In conclusion, despite the increase in trading volume, other technical indicators such as the negative MACD and the money flow indicators suggest a bearish trend. Therefore, potential investors should exercise caution and perhaps consider other investment opportunities.

The ‘Bull’ Perspective
Title: The Bullish Case for United Airlines Holdings, Inc.
Upfront:
1. United Airlines Holdings, Inc. demonstrated strong financial performance in Q3 2023, with a net income of $1.1 billion, an increase from $942 million in Q3 2022.
2. The airline benefited from increased demand for air travel and reduced fuel costs, leading to a 12.5% YOY increase in operating revenue.
3. Despite a decrease in cargo revenue, passenger revenue increased by 14.6% to $13.349 billion in Q3 2023.
4. The company's cash and cash equivalents reached $17.1 billion, up from $16.4 billion at the end of 2022.
5. United Airlines has firm commitments to purchase aircraft from Boeing and Airbus, indicating a strong future growth strategy.
1. Strong Financial Performance
United Airlines Holdings, Inc. has demonstrated robust financial performance in Q3 2023, posting a net income of $1.1 billion, a significant rise from $942 million in Q3 2022. This increase is indicative of the company's ability to weather economic uncertainties and capitalize on market opportunities. The operating income also increased to $1.7 billion in Q3 2023, up from $1.5 billion in Q3 2022, reflecting the company's operational efficiency and cost management.
2. Increased Demand and Reduced Fuel Costs
The airline industry has been experiencing a resurgence in demand for air travel, and United Airlines has been able to capitalize on this trend. The company reported a 14.4% increase in the number of passengers from 38,802 to 44,381. Furthermore, the company benefited from reduced fuel costs, with the average fuel price per gallon dropping by 22.6% from $3.81 in Q3 2022 to $2.95 in Q3 2023. This combination of increased demand and lower costs has contributed to the company's strong financial performance.
3. Increase in Passenger Revenue
Despite a 33.1% decrease in cargo revenue to $333 million, largely due to lower yields as a result of increased market capacity and rate pressures, United Airlines saw a substantial increase in passenger revenue. In Q3 2023, passenger revenue rose by 14.6% to $13.349 billion, demonstrating the company's ability to generate significant revenue from its core business.
4. Strong Cash Position
United Airlines' cash and cash equivalents reached $17.1 billion, up from $16.4 billion at the end of 2022. This increase in cash reserves provides the company with financial flexibility to navigate potential challenges and invest in growth opportunities. It also indicates the company's ability to generate positive cash flow from its operations.
5. Future Growth Strategy
United Airlines has firm commitments to purchase aircraft from Boeing and Airbus, indicating a strong future growth strategy. The company has scheduled deliveries through 2033 and has exercised options to purchase further aircraft from the two manufacturers. This investment in fleet expansion shows the company's commitment to growing its operations and enhancing its service offerings.
In conclusion, United Airlines Holdings, Inc. presents a compelling investment opportunity, underpinned by strong financial performance, increased demand for air travel, growing passenger revenue, a strong cash position, and a robust future growth strategy.

The ‘Bear’ Perspective
Title: A Bearish Case Against United Airlines Holdings, Inc.
Upfront Summary:
1. Increased operating expenses: United Airlines has experienced an 11.6% increase in operating expenses, a trend that could potentially eat into profit margins if not managed effectively.
2. Decrease in cargo revenue: Cargo revenue has significantly fallen by 33.1%, reflecting a potentially worrying trend in one of United's key revenue streams.
3. High debt levels: The airline's debt and financial liabilities as of September 30, 2023, stand at $19.7 billion, a figure that could pose significant risk to the company's financial stability.
4. Lower yields: Both the passenger revenue per available seat mile (PRASM) and the Total revenue per ASM (TRASM) have dropped, indicating lower yields.
5. Below investment grade credit ratings: The company's credit ratings remain below investment grade, which could hamper future financing efforts and affect the value of existing debt.
1. Increased Operating Expenses
United Airlines' operating expenses have risen by 11.6% to $12.745 billion. Significant increases were noticed in salaries and related costs, which rose by 37.7% due to a 12% increase in employee headcount, and landing fees and rent, increasing by 25.4%. These rising costs, if not effectively managed or offset by corresponding revenue increases, could potentially erode the company's profit margins, affecting investor returns.
2. Decrease in Cargo Revenue
The airline's cargo revenue has decreased by a substantial 33.1% to $333 million. This fall is largely due to lower yields as a result of increased market capacity and rate pressures. Given the importance of cargo revenue as a key revenue stream for the company, this trend could negatively impact the company's overall financial performance.
3. High Debt Levels
As of September 30, 2023, United Airlines' debt and financial liabilities stood at $19.7 billion, including $4.6 billion due within a year. High levels of debt can pose significant risks to a company's financial stability, particularly in an industry like aviation where profitability can be volatile and subject to factors beyond the company's control, such as fuel prices and global economic conditions.
4. Lower Yields
United Airlines' passenger revenue per available seat mile (PRASM) dropped by 1.0% and the Total revenue per ASM (TRASM) reduced by 2.8%. These numbers indicate that the company is earning less revenue for each seat mile available, which could be a sign of pricing pressure or reduced demand. This is a concerning trend for the company and its investors, as it could affect profitability.
5. Below Investment Grade Credit Ratings
United Airlines' credit ratings remain below investment grade, which could pose significant risks to the company's ability to secure future financing. This could also affect the value of existing debt and potentially increase borrowing costs. In an industry that requires significant capital investment, such as aviation, access to affordable financing is key to maintaining competitiveness and financial stability.
In conclusion, while United Airlines has seen some positive trends such as increased passenger numbers and reduced fuel costs, there are significant risks and challenges that the company faces. These include rising operating expenses, falling cargo revenue, high debt levels, lower yields, and below-investment-grade credit ratings. These factors, in combination, make a compelling bearish case against the company's stock.


Comments ()